What is needed to open long positions on EUR/USD
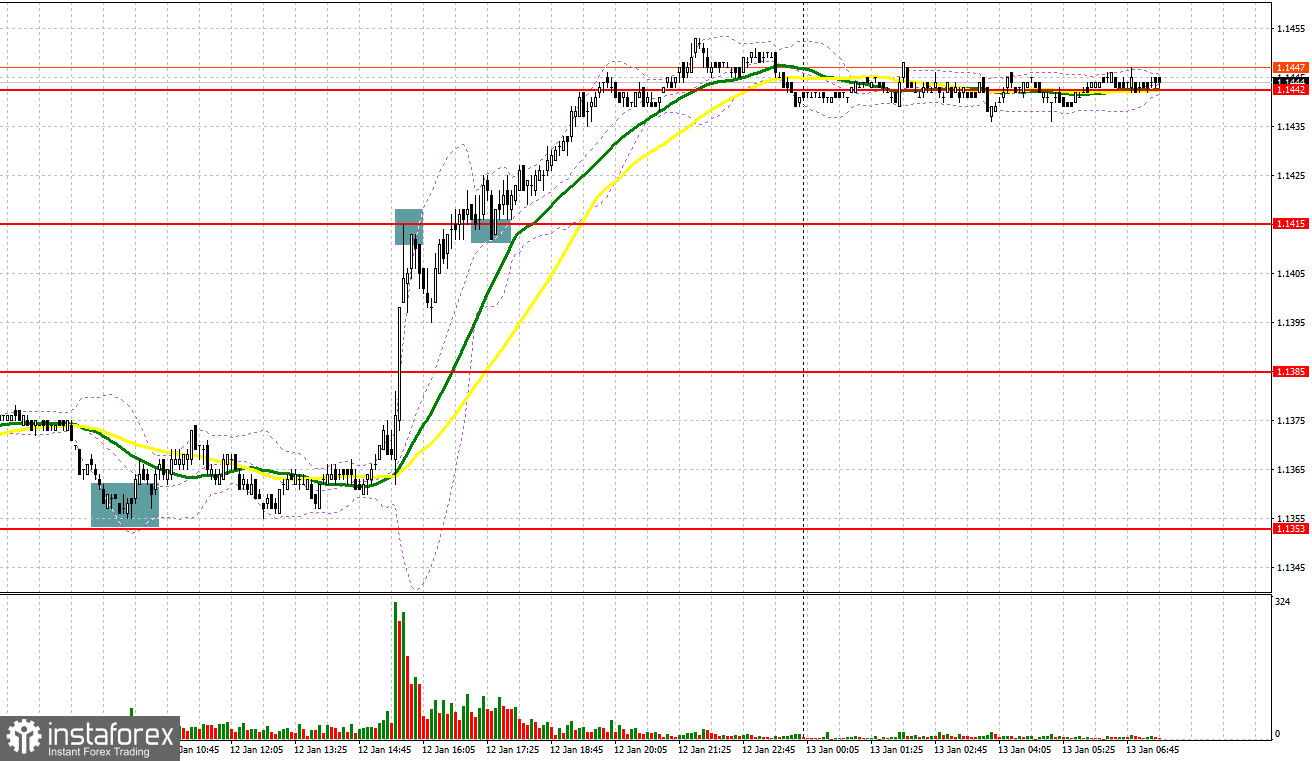
Yesterday, EUR/USD generated a few signals for the market entry. Now let's look at the 5-minute chart and try to figure out what actually happened. In my morning article yesterday, I spotted the level of 1.1363 and advised you to make trading decisions with this level in focus. After notable growth in the first half of the day, the euro bulls failed to sustain a further uptrend. Macroeconomic data for the EU was of little importance for the pair. Indeed, market participants were alert to US inflation data. The actual CPI matched the forecast in full. A false breakout of 1.1363 in the first half of the day and return to this level gave a signal for long positions. However, this signal was implemented in the second half of the day. In light of the inflation data, EUR/USD rose to 1.1415 where I recommended selling at a bounce with a 15-20 pips correction. This is actually happened. The opposite gave a signal to buy that pushed EUR up to the next resistance at 1.1442.
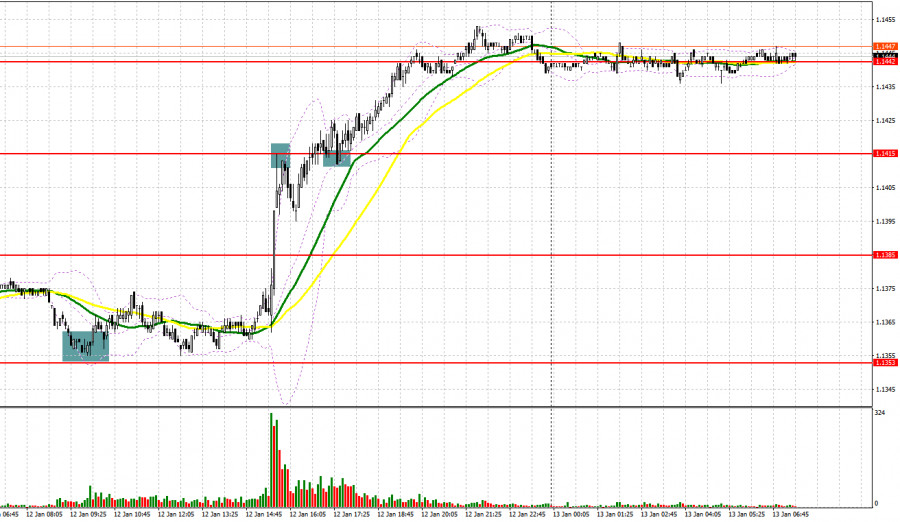
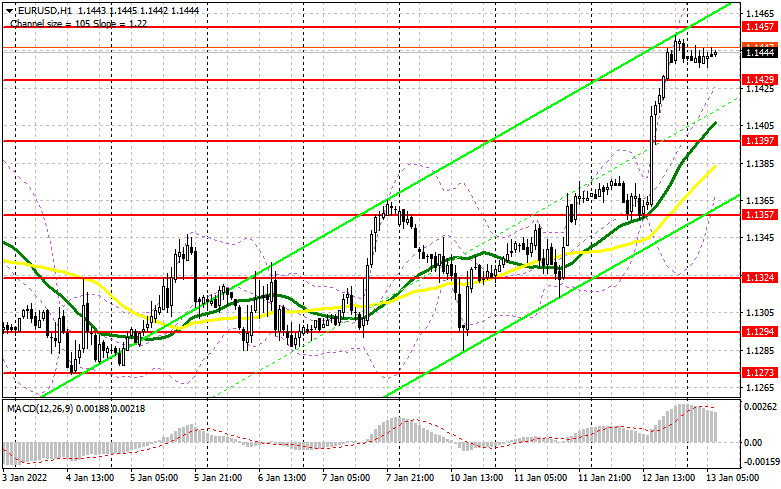
EUR buyers are currently holding the upper hand. They are not going to give up in the first half of the day. Their main task is to protect support of 1.1429 because it will determine a further price action. A breakout might lead to profit taking, pushing the pair down. EUR could climb to a new high at 1.1457 on a few conditions such as a fake breakout of support, strong Italy's industrial production data, and the ECB economic bulletin. EUR bulls should breach this area and make the opposite test downwards. This will open the way to a new bullish move towards 1.1484 and 1.1514 where I recommend profit taking.
1.1562 is seen a more distant target. If the currency pair declines during the European trade and the bulls are sluggish at 1.1429, it would be better to cancel buying until larger support at 1.1397. The bulls benefit from the moving averages passing slightly higher. Nevertheless, I would recommend opening long positions there in case of a fake breakout. We could buy EUR/USD at a price dip from 1.1357, bearing in mind an upward 20-25 pips correction intraday.
What is needed to open short positions on EUR/USD
The sellers lost control over the market, clinging to any resistance. If EUR/USD extends growth in the European session after the ECB bulletin and upbeat industrial production data from Italy, the sellers will have to do everything possible not to miss a new high of 1.1457. A climb above this level will pave the way to the bullish market that will hard to disrupt. A fake breakout at 1.1457 will create the first market entry point with short positions as the sellers will rely on a retracement towards interim support of 1.1429 amid downward pressure. This is the level to fight for. However, in case the bulls are not active enough, this level could be broken. A test of 1.1429 upwards will give an extra signal for opening short positions with the prospects of a decline to a large low of 1.1397. The moving averages crossing there benefit the bulls. The market sentiment will change into bearish in case the price goes beyond this area and trigger stop orders of the buyers. This price action will push EUR/USD down to lows at 1.1357 and 1.1324 where I recommend profit taking.
In case EUR gains ground and the bears are sluggish at 1.1457, it would be better not to rush selling the pair. The reasonable scenario will be opening short positions on condition of a fake breakout at nearly 1.1484. We could sell EUR/USD immediately at a bounce off the high of 1.1514 or higher at 1.1562, bearing in mind a 15-20 pips downward correction intraday.
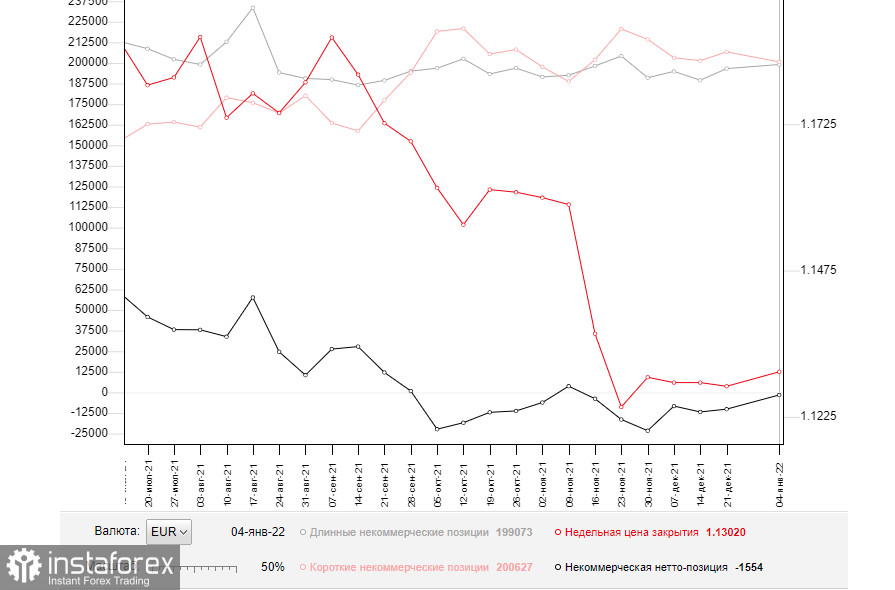
The COT (Commitment of Traders) report from January 4 logs a sharp increase in long positions and contraction in short positions that had an impact on the negative delta's value. It indicates that the market is changing its sentiment and demand for EUR remains strong despite the Fed's hawkishness and its shift towards aggressive monetary tightening. The highlight of the week is an inflation report from the US. The US CPI jumped above 7% on year in December. Fresh evidence of soaring inflation will force the US central bank to speed up monetary tightening with the first rate hike sooner than later. Another thing is that the US labor market is improving steadily. In this context, we can reckon that the US regulator might increase interest rates at least 4 times this year.
The ECB is going to withdraw its emergency bond-buying program in full in March 2022. However, the regulator does not plan other moves towards tightening its monetary policy. This dovish stance caps the upside potential of risky assets.
According to the last COT report, long non-commercial positions grew to 199,073 from 196,595 for the week. At the same time, short non-commercial positions dropped from 206,757 to 200,627. It proves that traders are poised to add long positions on EUR/USD bearing in mind a further upward correction of EUR/USD. By and large, the overall non-commercial net positions declined from -10,162 to -1,554. EUR/USD closed last week a bit higher at 1.1302 against 1.1277 a week ago.
Indicator's signals:
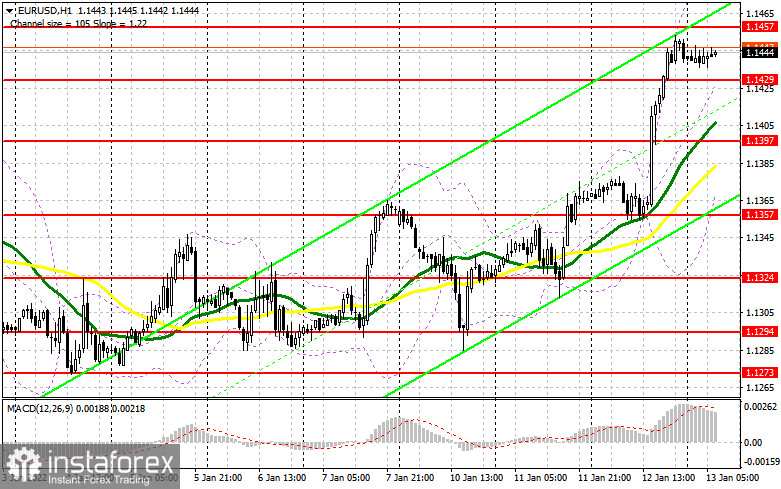
Trading is carried out above the 30 and 50 daily moving averages. It indicates further growth of EUR in the short term.
Moving averages
Note: The period and prices of moving averages are considered by the author on the H1 hourly chart and differs from the general definition of the classic daily moving averages on the daily D1 chart.
Bollinger Bands
If EUR/USD declines, the lower border of 1.1397 will serve as support. In case the currency pair grows, the indicator's border at 1.1484 will serve as resistance.
Description of indicators
- Moving average (moving average, determines the current trend by smoothing out volatility and noise). Period 50. It is marked yellow on the chart.
- Moving average (moving average, determines the current trend by smoothing out volatility and noise). Period 30. It is marked green on the chart.
- MACD indicator (Moving Average Convergence/Divergence — convergence/divergence of moving averages) Quick EMA period 12. Slow EMA period to 26. SMA period 9
- Bollinger Bands (Bollinger Bands). Period 20
- Non-commercial speculative traders, such as individual traders, hedge funds, and large institutions that use the futures market for speculative purposes and meet certain requirements.
- Long non-commercial positions represent the total long open position of non-commercial traders.
- Short non-commercial positions represent the total short open position of non-commercial traders.
- Total non-commercial net position is the difference between short and long positions of non-commercial traders.