Analyzing Thursday's trades:
EUR/USD on 1H chart
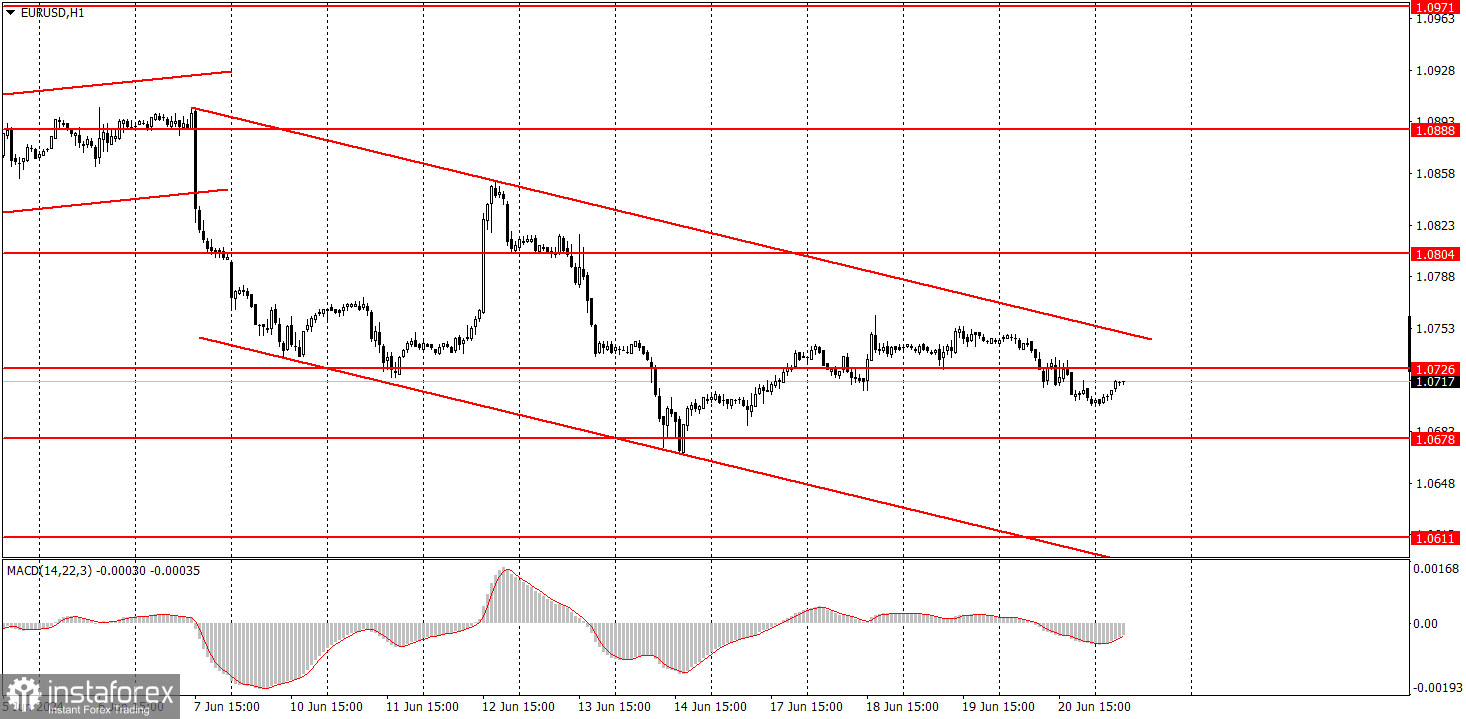
Yesterday, EUR/USD started a weak downward movement within a descending channel on the hourly chart, a downtrend on the 4-hour chart, and a global downtrend on the 24-hour chart. In our opinion, it was absolutely logical for the pair to go through a bearish reversal, even without a fundamental and macroeconomic background. Take note that the next wave of the euro's decline began roughly around the time when the European Central Bank and the Federal Reserve announced the results of their latest meetings. The ECB has finally embarked on a new monetary policy by cutting its rates, while the Fed is not expected to do so for quite some time. Thus, the divergence between the interest rates of the American and European central banks will increase in the coming months. This puts the euro in a very unfavorable position. In the current circumstances, the pair is expected to continue its decline.
EUR/USD on 5M chart
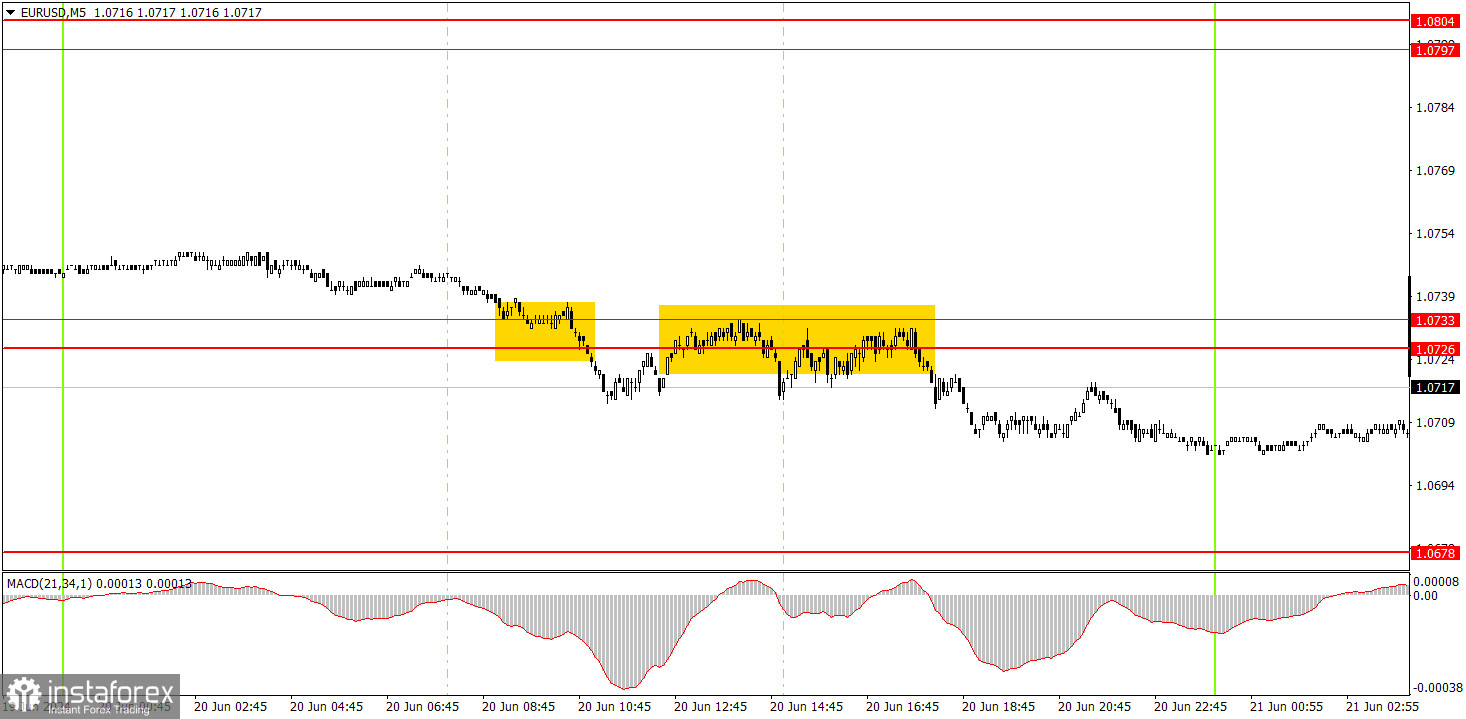
Two trading signals were formed on the 5-minute timeframe, which essentially duplicated each other. Initially, the pair consolidated below the 1.0726-1.0733 area, and then it repeatedly bounced off this area from below. Thus, beginners could open short positions yesterday. Since volatility was quite low (as was the macroeconomic background), we did not see a significant decline in the euro. However, the euro continues to exhibit low volatility day by day, so there is nothing surprising about this. Today, short positions can be held as long as the price remains below the 1.0726-1.0733 area.
Trading tips on Friday:
On the hourly chart, EUR/USD finally started to form a local downward trend. We still expect the pair to drop to levels of 1.0600, 1.0450, and maybe even 1.0200. However, it's important to understand that the price will not reach these targets immediately; they are medium-term. For instance, the pair could freely go through a corrective phase for another week. Nonetheless, we don't see any reasons for the euro to rise in the medium-term.
On Friday, traders can expect a new downward movement, as the price has breached the 1.0726-1.0733 area. However, it's worth considering that volatility might be low.
The key levels on the 5M chart are 1.0483, 1.0526, 1.0568, 1.0611, 1.0678, 1.0726-1.0733, 1.0797-1.0804, 1.0838-1.0856, 1.0888-1.0896, 1.0940, 1.0971-1.0981. Today, the Eurozone, Germany, and the United States are scheduled to release business activity indexes for the services and manufacturing sectors. These data, given the low volatility of the pair, could trigger a significant movement. However, "significant" in terms of current volatility means around 20-30 pips.
Basic trading rules:
1) Signal strength is determined by the time taken for its formation (either a bounce or level breach). A shorter formation time indicates a stronger signal.
2) If two or more trades around a certain level are initiated based on false signals, subsequent signals from that level should be disregarded.
3) In a flat market, any currency pair can produce multiple false signals or none at all. In any case, the flat trend is not the best condition for trading.
4) Trading activities are confined between the onset of the European session and mid-way through the U.S. session, after which all open trades should be manually closed.
5) On the 30-minute timeframe, trades based on MACD signals are only advisable amidst substantial volatility and an established trend, confirmed either by a trendline or trend channel.
6) If two levels lie closely together (ranging from 5 to 15 pips apart), they should be considered as a support or resistance zone.
How to read charts:
Support and Resistance price levels can serve as targets when buying or selling. You can place Take Profit levels near them.
Red lines represent channels or trend lines, depicting the current market trend and indicating the preferable trading direction.
The MACD(14,22,3) indicator, encompassing both the histogram and signal line, acts as an auxiliary tool and can also be used as a signal source.
Significant speeches and reports (always noted in the news calendar) can profoundly influence the price dynamics. Hence, trading during their release calls for heightened caution. It may be reasonable to exit the market to prevent abrupt price reversals against the prevailing trend.
Beginners should always remember that not every trade will yield profit. Establishing a clear strategy coupled with sound money management is the cornerstone of sustained trading success.