Yesterday, EUR/USD showed the movements that we should have expected. Let us briefly recall the chronology of events. About a week ago, after the release of the NonFarm Payrolls report and after two months of going through a bullish correction, the pair should have finally ended its upward movement. Since globally we still have a downtrend, it was reasonable to expect the euro to resume its decline. The euro did fall for several consecutive days, but then the notorious U.S. inflation report was published. The U.S. Consumer Price Index slowed for the second consecutive month, which clearly did not pull the dollar down by 100-pips. On Wednesday evening, the Federal Reserve announced the results of its FOMC meeting. The interest rate remained unchanged, there were no signs of monetary policy easing in the coming months, Fed Chair Jerome Powell even said that inflation is still too high to consider a rate cut, and the "dot-plot" chart showed that the FOMC's dovish expectations are getting weaker. Thus, everything suggested that the dollar should rise.
However, at the end of the day the dollar fell. After the inflation report it lost more than 100 pips, and after the Fed meeting it gained no more than 50 pips. Although it should have been the other way around. Therefore, we can consider yesterday's movement "artificial". As many traders on the market expect the downward movement to resume, at a certain point of time, under the successful macroeconomic background, market-makers pushed the pair up to "eat" the Stop Losses of the market participants. After that, as it happened, the pair quietly fell. We insist that the euro should fall further. And the recent meetings of the European Central Bank and the Fed only assured us of this belief. Recall that the Fed left the monetary policy unchanged, while the ECB has already begun to lower its rate.
We have already mentioned that we should not draw conclusions until 24 hours have passed since the Fed meeting. The market often takes a long time to work out such important events. Yesterday, the pair quietly consolidated back below the moving average, which allows us to expect a decline on the 4-hour TF. Also, take note that the euro did not fall due to Thursday's macro data. In the morning, the Eurozone industrial production report was published, which showed a lower value than the market expected. However, industrial production is just a minor report. Similar reports are published quite often, and the general macro data in the European Union have left much to be desired for a couple of years now. If the single currency were to react to weak EU reports by falling each time, it would trade near the price parity.
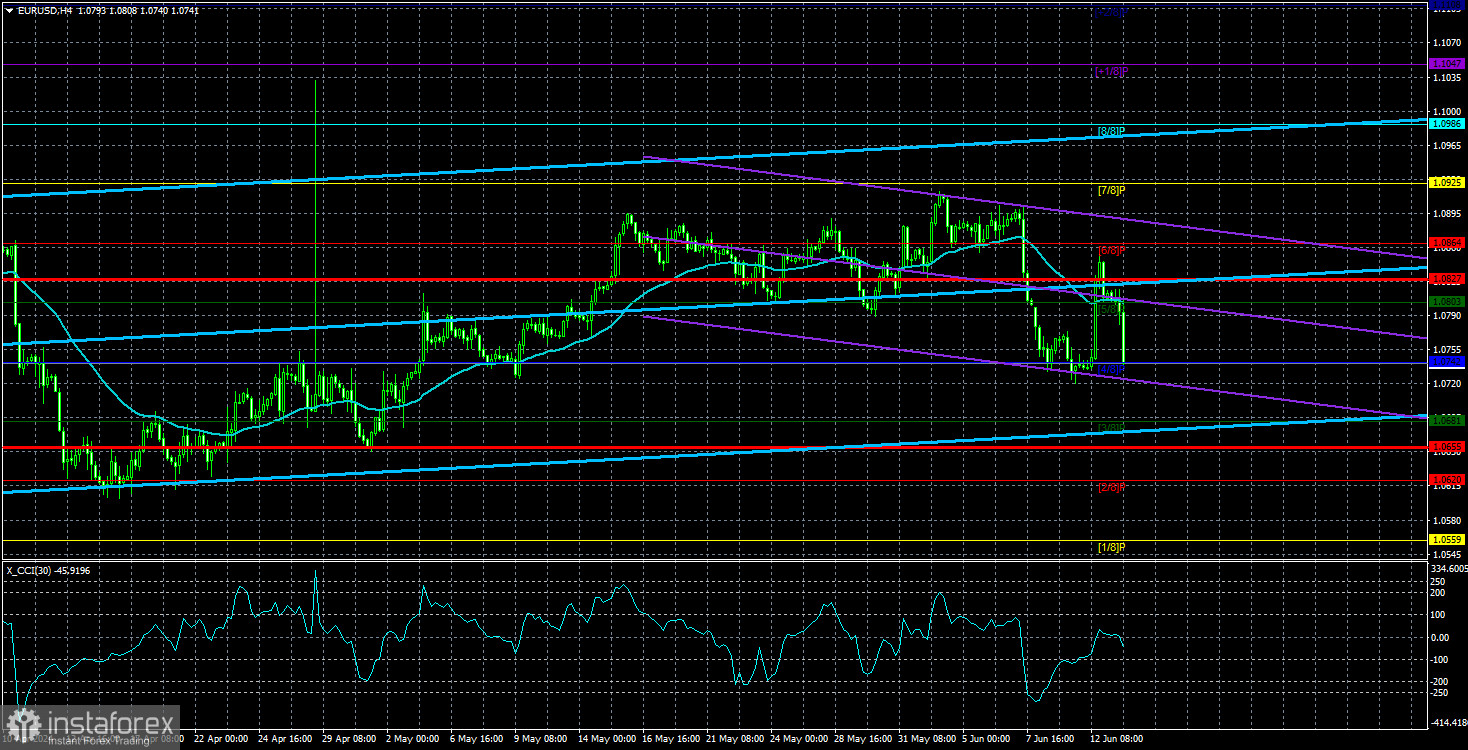
As a result, we can say that the general picture of EUR/USD has not changed. We still expect a decline, if we consider the fundamentals, macroeconomics and technique. On the 24-hour TF, the pair has once again consolidated below the Ichimoku indicator lines, which is another signal for a new round of the downtrend.
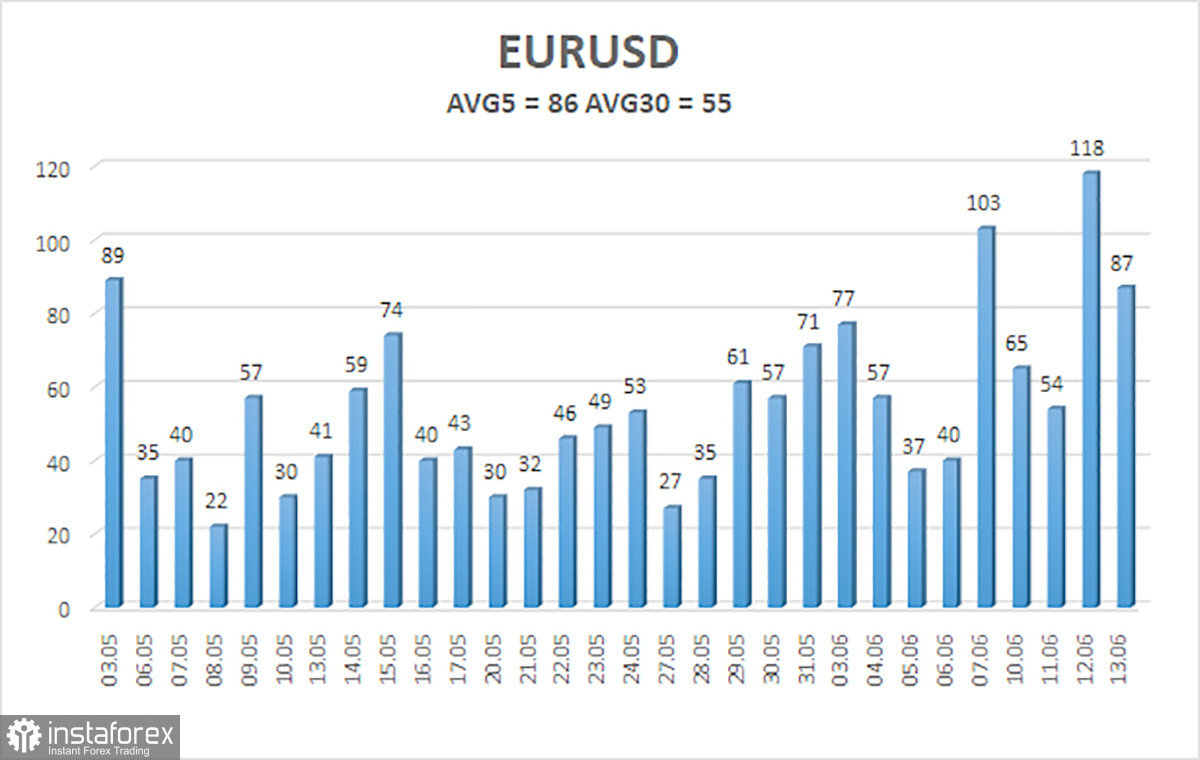
The average volatility of the EUR/USD pair over the last five trading days as of June 14 is 86 pips, which is considered an average value. We expect the pair to move between the levels of 1.0827 and 1.0655 on Friday. The higher linear regression channel has turned upwards, but the global downtrend persists. The CCI indicator entered the oversold area once again, but at this time we do not expect the uptrend to resume.
Nearest support levels:
S1 - 1.0742
S2 - 1.0681
S3 - 1.0620
Nearest resistance levels:
R1 - 1.0803
R2 - 1.0864
R3 - 1.0925
Trading Recommendations:
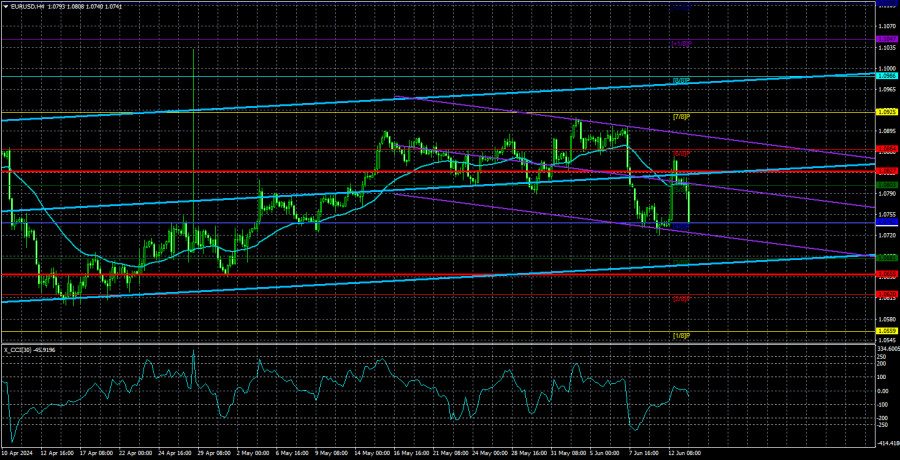
The EUR/USD pair maintains a global downtrend, but on the 4-hour TF, it has once again consolidated above the moving average. In the previous review, we said that we will not consider long positions and that we should wait for the downtrend to resume. Yesterday, it was possible to enter the market with short positions after the price consolidated below the moving average. The targets are 1.0681 and 1.0655. We still do not consider long positions, as we believe that the global downtrend has resumed, and the euro has no grounds for growth.
Explanation of Illustrations:
- Linear Regression Channels – Helps determine the current trend. If both are directed in the same direction, it means the trend is currently strong.
- Moving Average Line (settings 20.0, smoothed) – Determines the short-term trend and the direction in which trading should currently be conducted.
- Murray Levels – Target levels for movements and corrections.
- Volatility Levels (red lines) – The probable price channel in which the pair will spend the next day, based on current volatility indicators.
- CCI Indicator – Its entry into the oversold area (below -250) or the overbought area (above +250) means that a trend reversal in the opposite direction is imminent.