EUR/USD
Analysis:
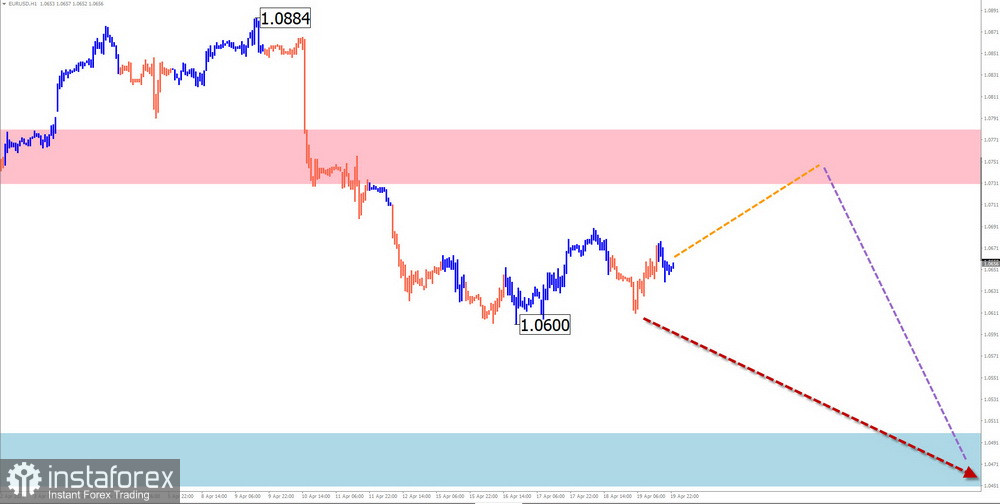
Quotes of the European currency in the main pair have been forming a horizontal descending pennant since July of last year. The final part (C) is developing within the wave structure. Major quotes have pressed the upper level of a powerful potentially reversal zone. Last week, the price drifted, forming an intermediate retracement.
Forecast:
In the coming days, a general sideways movement of the euro is expected. After a likely rebound from the resistance zone, a reversal and resumption of the pair's decline are expected. When changing direction, a temporary breach of the upper boundary of the zone cannot be ruled out. An increase in volatility can be expected closer to the weekend.
Potential Reversal Zones
Resistance:
Support:
Recommendations:
Selling: there are no conditions for such transactions in the pair market.
Buying: may become the main direction of trading deals after confirmed signals appear in the support area.
USD/JPY
Analysis:
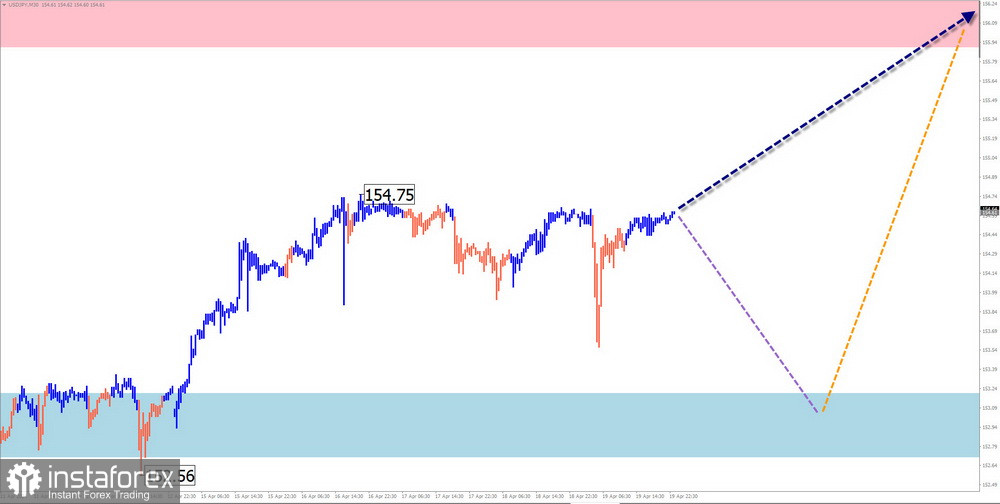
Since July of last year, the position of the Japanese yen has weakened relative to the American currency. On the chart, the last unfinished section along the main course has been accounted for since March 8th. Major quotes last week pressed the accumulation zone of resistance levels on various chart scales. Before continuing the course growth, the wave structure needs to consolidate at the level as a correction.
Forecast:
In the upcoming weekly period, a continuation of the general horizontal course of price movement is expected. In the coming days, a downward vector is more likely, with a decrease in price to the calculated support zone. By the end of the week, a resumption of price growth can be expected. The calculated resistance zone acts as the boundary of the weekly course.
Potential Reversal Zones
Resistance:
Support:
Recommendations:
Buying: will become relevant after the appearance of confirmed reversal signals in the support area of the trading systems you use.
Selling: possible within individual sessions with reduced lot size. The potential is limited by support.
GBP/JPY
Analysis:
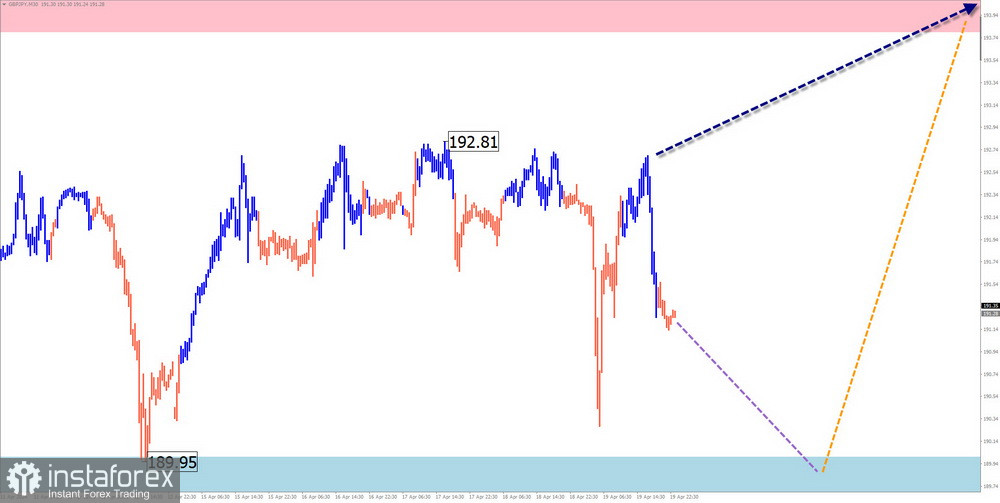
On the chart of the British pound/Japanese yen, the ascending wave of the weekly scale continues to dominate. At the end of last month, the price reached another resistance level, along which it later formed an intermediate correction. The potential of the ascending section from April 12th has a reversal potential.
Forecast:
A short-term downward retracement is not excluded in the first half of the upcoming week, with a decrease in the support zone. An attempt to pressure the support zone cannot be ruled out. It is likely to stay within its lower boundary. Increased activity, reversal, and resumption of price growth can be expected by the end of the week.
Potential Reversal Zones
Resistance:
Support:
Recommendations:
Selling: risky, can lead to deposit loss.
Buying: can be used in trading after confirmed reversal signals appear in the support area.
USD/CAD
Analysis:
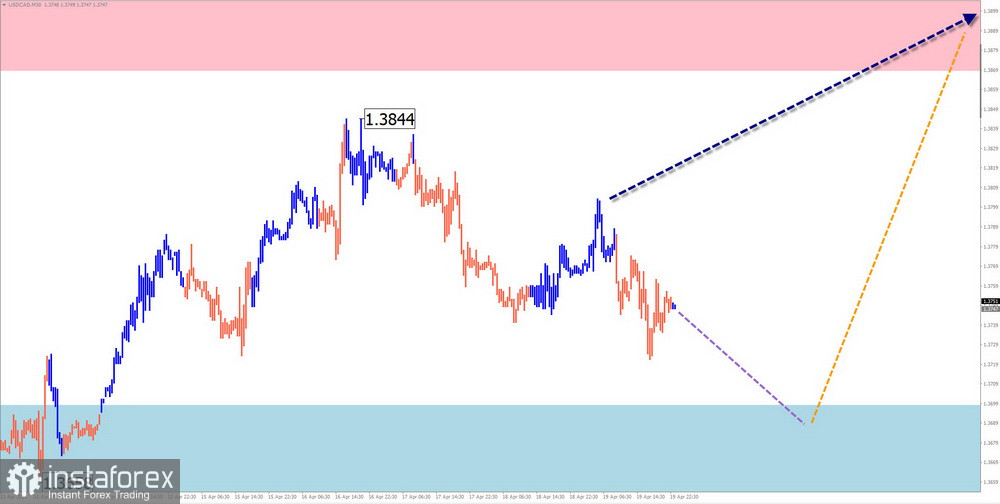
The lack of a pronounced trend on the chart of the main pair of the Canadian dollar is caused by the formation of an ascending plane since July last year. An intermediate retracement is forming from last week within the final unfinished section (C) up to date. Calculated zones are located at the boundaries of a wide potential reversal zone on a weekly scale.
Forecast:
In the nearest week, a continuation of the general sideways direction of the price movement course is expected within the price corridor between the nearest opposing zones. In the first few days, a downward vector is more likely. By the end of the week, an increase in quotes of the pair can be expected.
Potential Reversal Zones
Resistance:
Support:
Recommendations:
Selling: has low potential and may need to be more profitable for the deposit.
Buying: this will become relevant after confirming signals appear in the support area on your trading systems.
NZD/USD
Analysis:
The main direction of price fluctuations on the chart of the major pair of the New Zealand dollar shows a downward wave algorithm since July of last year. The final part (C) is forming within the structure. Quotes reached the upper boundary of powerful potential reversal zones of the weekly timeframe. The ascending section from April 19th has a reversal potential.
Forecast:
At the beginning of the upcoming week, pressure on the support zone is expected. A temporary breach of its lower boundary is possible. Further, a change in direction and resumption of the upward price movement can be expected.
Potential Reversal Zones
Resistance:
Support:
Recommendations:
Selling: has no potential, may lead to losses.
Buying: will become relevant after confirmed reversal signals appear in the support area.
Gold
Quotes of the gold index continue to update record values. After breaking through another resistance level, the gold chart drifted along the 25 price figure. After completing the correction, the instrument's growth will continue.
Forecast:
At the beginning of the upcoming week, a flat movement setting is expected, with an attempt to exert pressure on the resistance zone again. In the second half, there is a high probability of forming a reversal and the beginning of a price decrease. The lower boundary of the expected weekly course demonstrates the calculated support.
Potential Reversal Zones
Resistance:
Support:
Recommendations:
Buying: has low potential and may be risky.
Selling: premature until clear reversal signals appear on your trading systems.
Explanations: In simplified wave analysis (SWA), all waves consist of 3 parts (A-B-C). The last unfinished wave is analyzed on each TF. Dotted lines indicate expected movements.
Attention: The wave algorithm does not consider the duration of instrument movements over time!