Analyzing Wednesday's trades:
GBP/USD on 30M chart
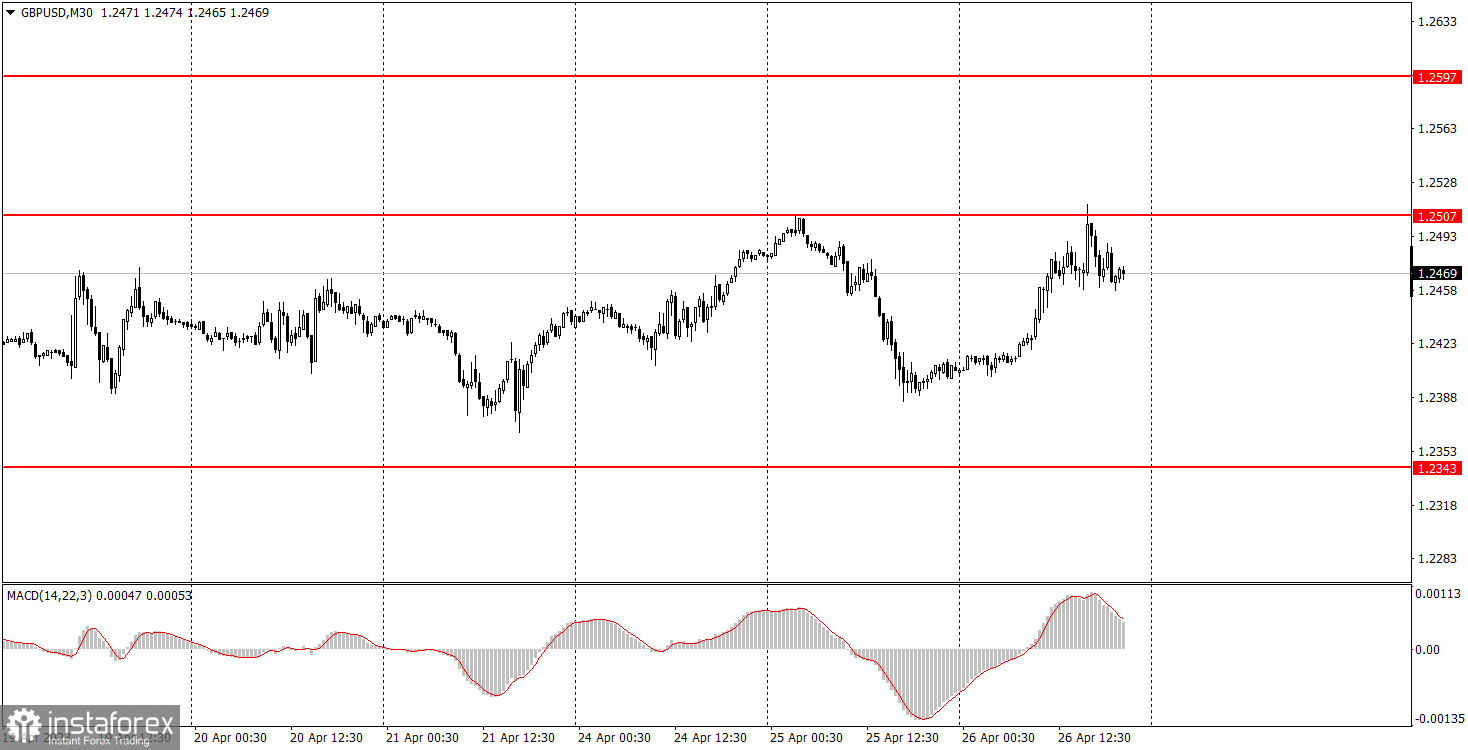
The GBP/USD pair also showed unreasonable growth on Wednesday, but at the same time, this movement can be considered logical for the pound. The fact is that the pair has been trading in a horizontal channel of about 200 points wide for three weeks now, which is clearly visible on the hourly and 4-hour chart. Thus, the pair simply showed movement within this channel on Wednesday, and the sideways direction is noticeable even on the 30-minute chart. Is it worth mentioning that there was no important data on Wednesday that could provoke the pound's growth? The only report of the day on durable goods orders was in favor of the dollar... A bounce from the new level of 1.2507 may provoke a new wave of downward movement within the flat.
GBP/USD on 5M chart
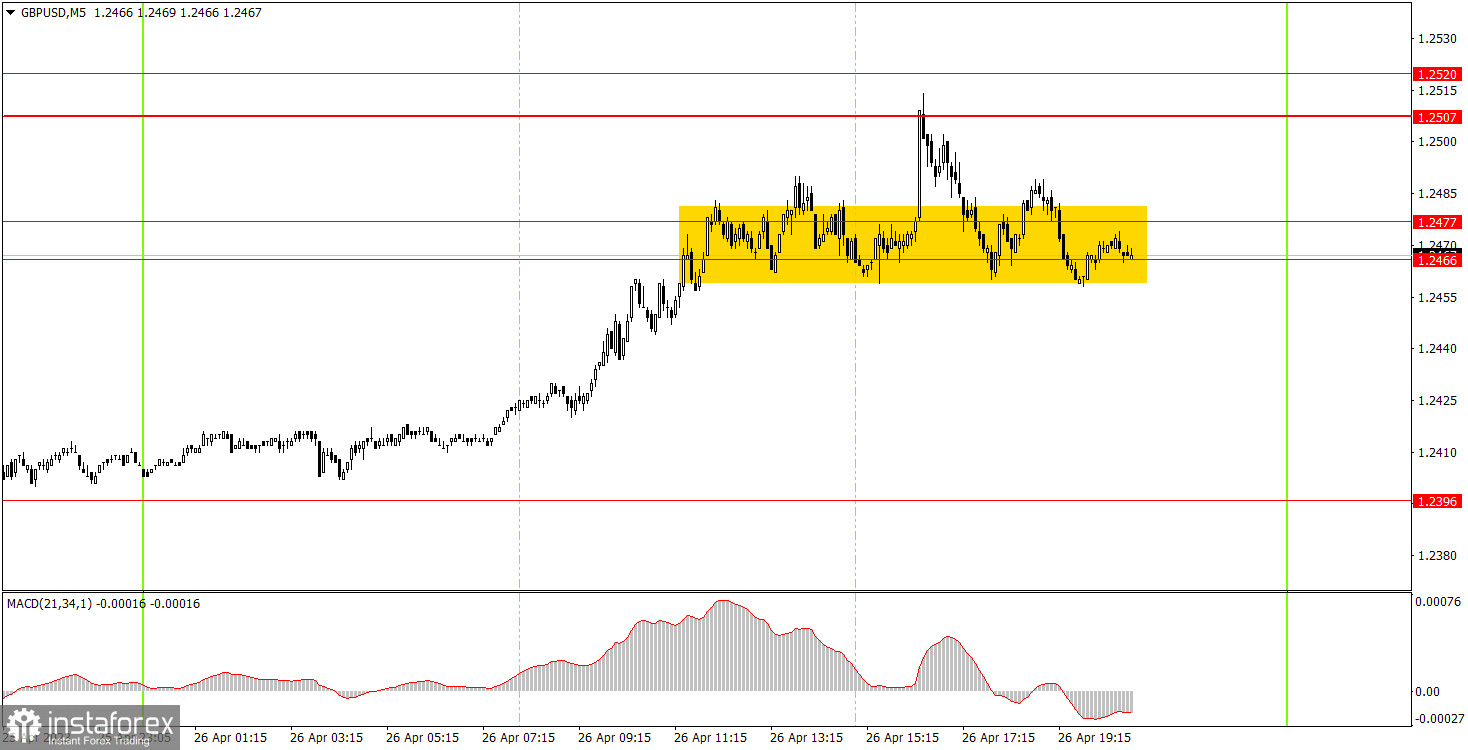
Trading signals on the 5-minute chart were quite complicated for novice traders. First, the pair started moving higher at night, and the buy signal was formed on Tuesday evening. The pair bounced off 1.2196, after which the growth began. Therefore, at the beginning of the European trading session, it was quite possible to open long positions, by that time the price had moved away from the formation point by about 10 points. However, this was not an obvious decision, so we did not highlight this signal. Next, the pair reached the area of 1.2466-1.2477 and got stuck in it for many hours. Once it even settled above it, but immediately found itself near the nearest target in the form of the 1.2520 level, so it was not necessary to open a long position. The 1.2507 level is new, so there was no sell signal recorded near it. As a result, novice traders should not have opened deals on Wednesday.
Trading tips on Thursday:
On the 30-minute chart, GBP/USD seems to be just moving sideways. Thus, the illogical movements are added to the flat. Just a remarkable situation for traders of any level. The current state of affairs should be taken into account when opening any positions in the market. On the 5-minute chart, it is recommended to trade at the levels 1.2171-1.2179, 1.2245-1.2260, 1.2343-1.2360, 1.2396, 1.2466-1.2477, 1.2507-1.2520, 1.2577-1.2597-1.2616. As soon as the price passes 20 pips in the right direction, you should set a Stop Loss to breakeven. On Thursday, there are no important events planned in the UK, and in the US, a report on GDP for the fourth quarter will be published. However, for the third straight day, the market shows that there is no logic in its reaction and movements, and it can trade quite volatile and trendy even without important data.
Basic rules of the trading system:
1) The strength of the signal is determined by the time it took the signal to form (a rebound or a breakout of the level). The quicker it is formed, the stronger the signal is.
2) If two or more positions were opened near a certain level based on a false signal (which did not trigger a Take Profit or test the nearest target level), then all subsequent signals at this level should be ignored.
3) When trading flat, a pair can form multiple false signals or not form them at all. In any case, it is better to stop trading at the first sign of a flat movement.
4) Trades should be opened in the period between the start of the European session and the middle of the US trading hours when all positions must be closed manually.
5) You can trade using signals from the MACD indicator on the 30-minute time frame only amid strong volatility and a clear trend that should be confirmed by a trendline or a trend channel.
6) If two levels are located too close to each other (from 5 to 15 pips), they should be considered support and resistance levels.
On the chart:
Support and Resistance levels are the levels that serve as targets when buying or selling the pair. You can place Take Profit near these levels.
Red lines are channels or trend lines that display the current trend and show in which direction it is better to trade now.
The MACD indicator (14, 22, and 3) consists of a histogram and a signal line. When they cross, this is a signal to enter the market. It is recommended to use this indicator in combination with trend patterns (channels and trendlines).
Important announcements and economic reports that can be found on the economic calendar can seriously influence the trajectory of a currency pair. Therefore, at the time of their release, we recommend trading as carefully as possible or exiting the market in order to avoid sharp price fluctuations.
Beginners on Forex should remember that not every single trade has to be profitable. The development of a clear strategy and money management is the key to success in trading over a long period of time.