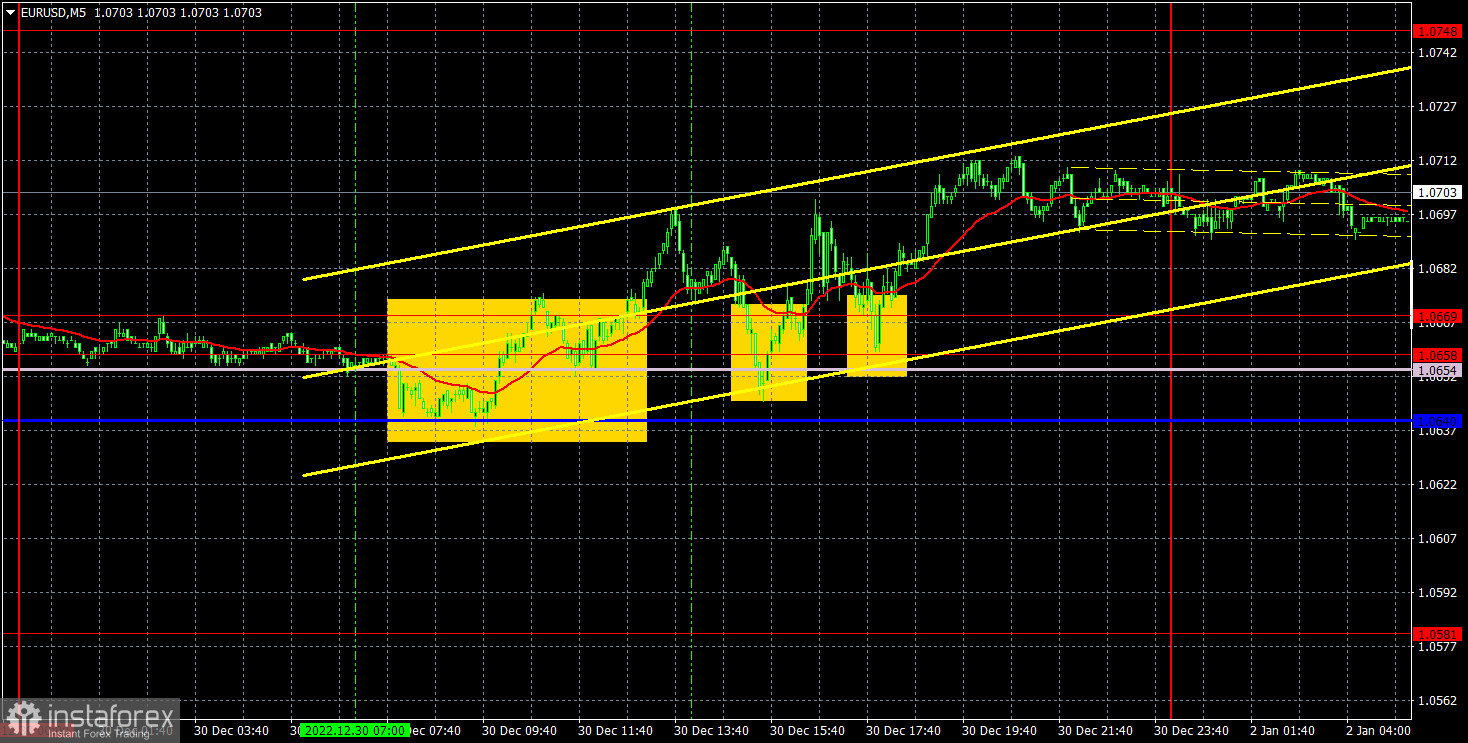
M5 chart of EUR/USD
EUR/USD continued to grow in a sluggish manner during the last trading day of the New Year, but in general the pair's movement in recent weeks still looks like a flat. The euro failed to correct against the upward movement of the last few months, despite the fact that there were plenty of opportunities to do so. So we go into the new year with the same set of factors and the state of the market mood. At this rate, the single currency may continue to rise this week, because the market simply refuses to sell the euro and buy the dollar right now. We have repeatedly talked about why the euro should fall and for example, the pound corrected by nearly 500 points late last year. But if the market refuses to sell, there can be no downward movement.
There were several trading signals on Friday, December 30. Traders had the 1.0640-1.0669 area, within which there were two more levels and lines. Therefore, all three buy signals were formed when the price bounced or crossed the entire area, rather than individual price levels. In each of the three cases, the price went up at least 20 pips so traders could and should have put the Stop Loss to Breakeven. Consequently, there was no loss on any of the open positions (if traders opened them on the last trading day of the year), but it is unlikely that they also managed to make profit on them.
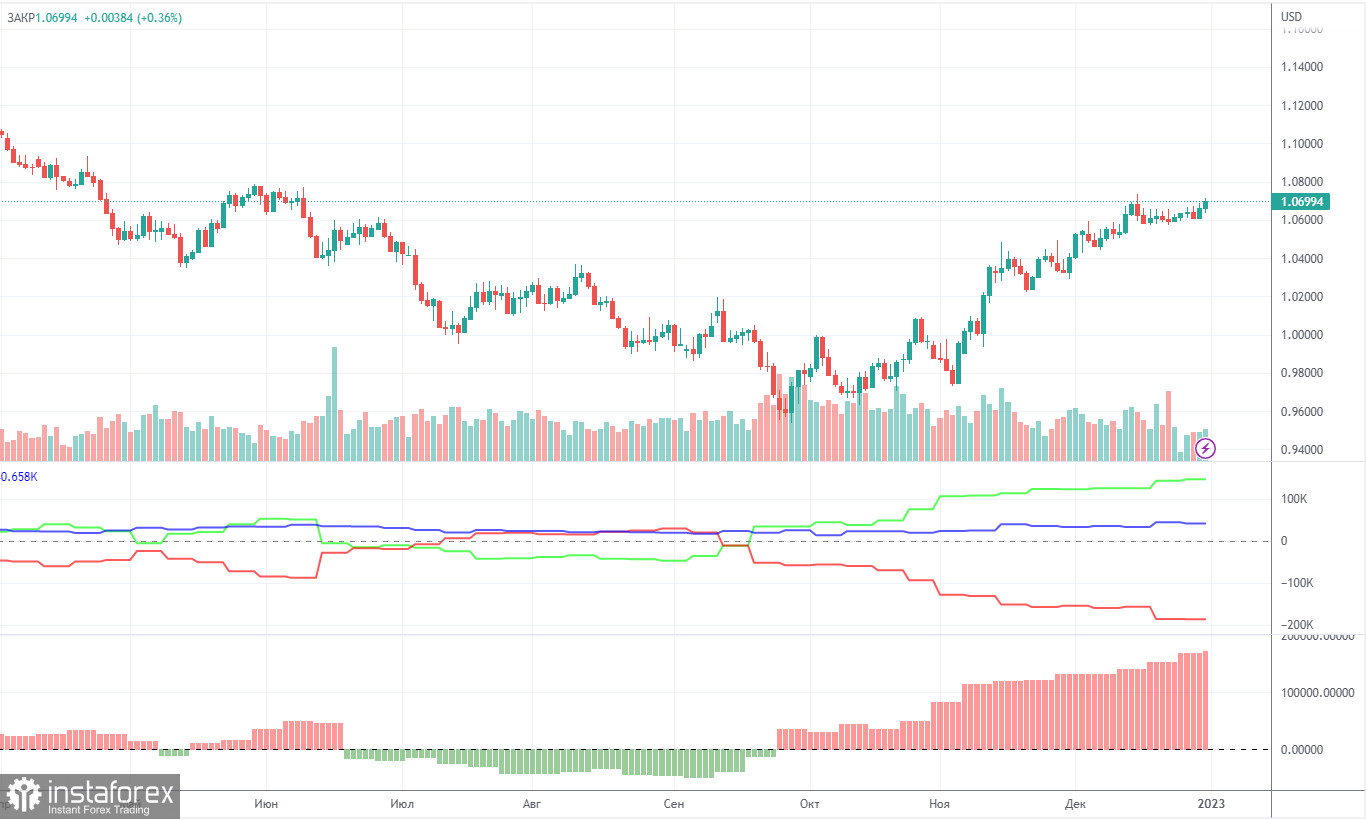
COT report
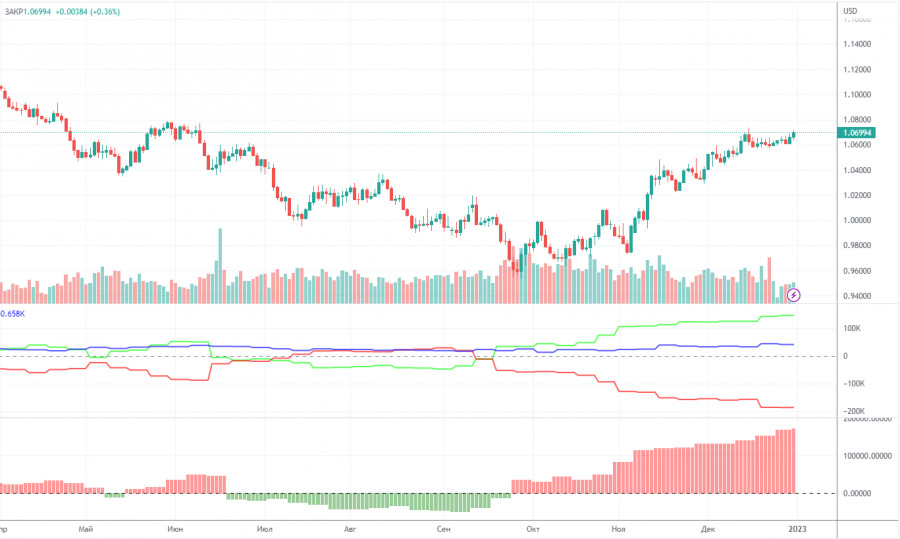
The COT reports for the euro in the last few months have been fully consistent with what is happening in the market. You can clearly see on the chart that the net position of big players (the second indicator) has been growing since early September. Around the same time, the euro started to grow. At this time, the net position of the non-commercial traders has been bullish and strengthens almost every week, but it is a rather high value that allows us to assume that the upward movement will end soon. Notably, the green and red lines of the first indicator have moved far apart from each other, which often means the end of the trend. During the given period, non-commercial traders opened 2,700 long positions, whereas the number of short positions fell by 1,100. Thus, the net positions rose by 3,800. The number of long positions is 146,000 higher than the number of short positions opened by non-commercial traders. So the question now is how long will the big players increase their longs? Moreover, from a technical perspective, a bearish correction should have started a long time ago. In my opinion, this process can not continue for another 2 or 3 months. Even the net position indicator shows that we need to "unload" a bit, that is, to correct. The overall number of short orders exceeds the number of long orders by 41,000 (685,000 vs. 644,000).
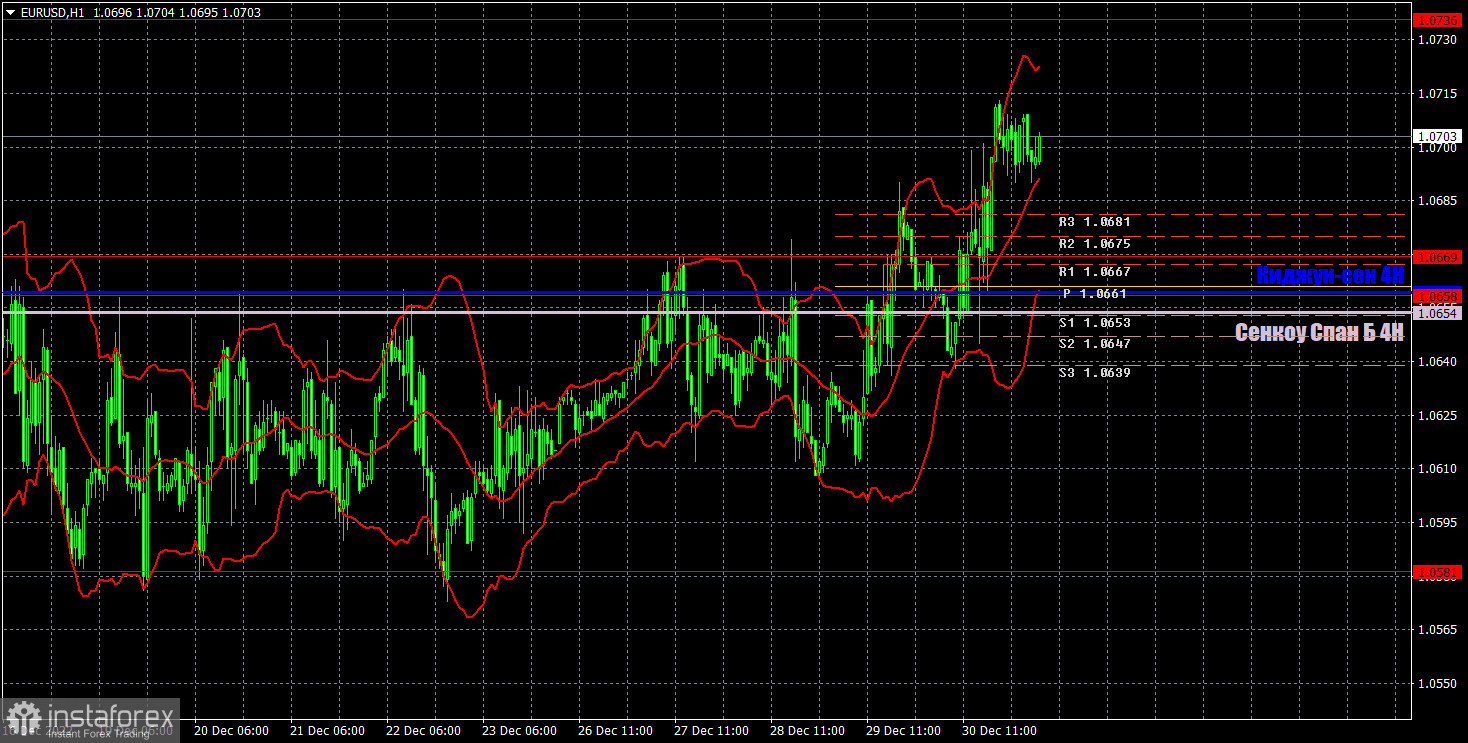
H1 chart of EUR/USD
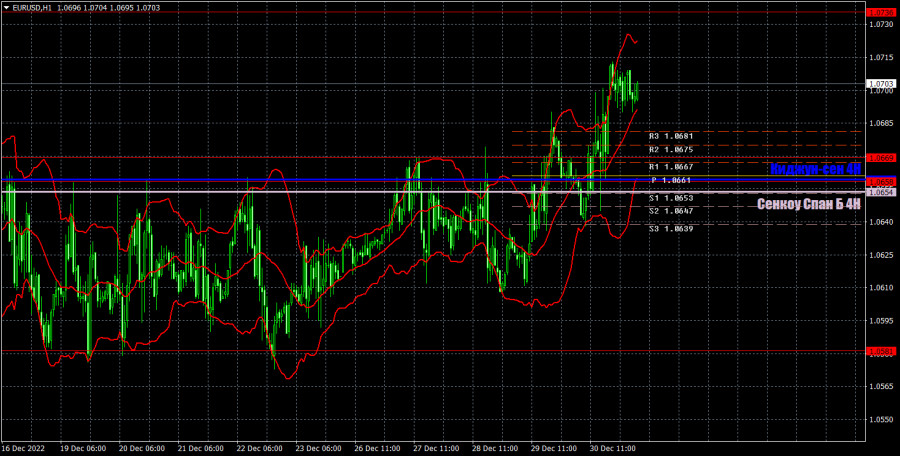
EUR/USD is still in a high position on the one-hour chart, and is still in a total flat. Lines of the Ichimoku indicator are very close to each other and have lost meaning. Since the euro is inclined to rise, we have moved the Ichimoku lines to their real price values, but the price can cross them easily and freely several times a day. On Monday, the pair may trade at the following levels: 1.0340-1.0366, 1.0485, 1.0581, 1.0658-1.0669, 1.0736, 1.0806, as well as Senkou Span B (1.0654) and Kijun Sen (1.0660). Lines of the Ichimoku indicator may move during the day, which should be taken into account when determining trading signals. There are also support and resistance levels, but signals are not formed near these levels. Bounces and breakouts of the extreme levels and lines could act as signals. Don't forget about stop-loss orders, if the price covers 15 pips in the right direction. This will prevent you from losses in case of a false signal. On January 2, the EU will release its manufacturing activity report for December (final value). I don't expect a significant reaction from the market. The flat will likely persist.
What we see on the trading charts:
Price levels of support and resistance are thick red lines, near which the movement may end. They do not provide trading signals.
The Kijun-sen and Senkou Span B lines are the lines of the Ichimoku indicator, moved to the one-hour chart from the 4-hour one. They are strong lines.
Extreme levels are thin red lines from which the price bounced earlier. They provide trading signals.
Yellow lines are trend lines, trend channels, and any other technical patterns.
Indicator 1 on the COT charts reflects the net position size of each category of traders.
Indicator 2 on the COT charts reflects the net position size for the non-commercial group.