To open long positions on EUR/USD, you need:
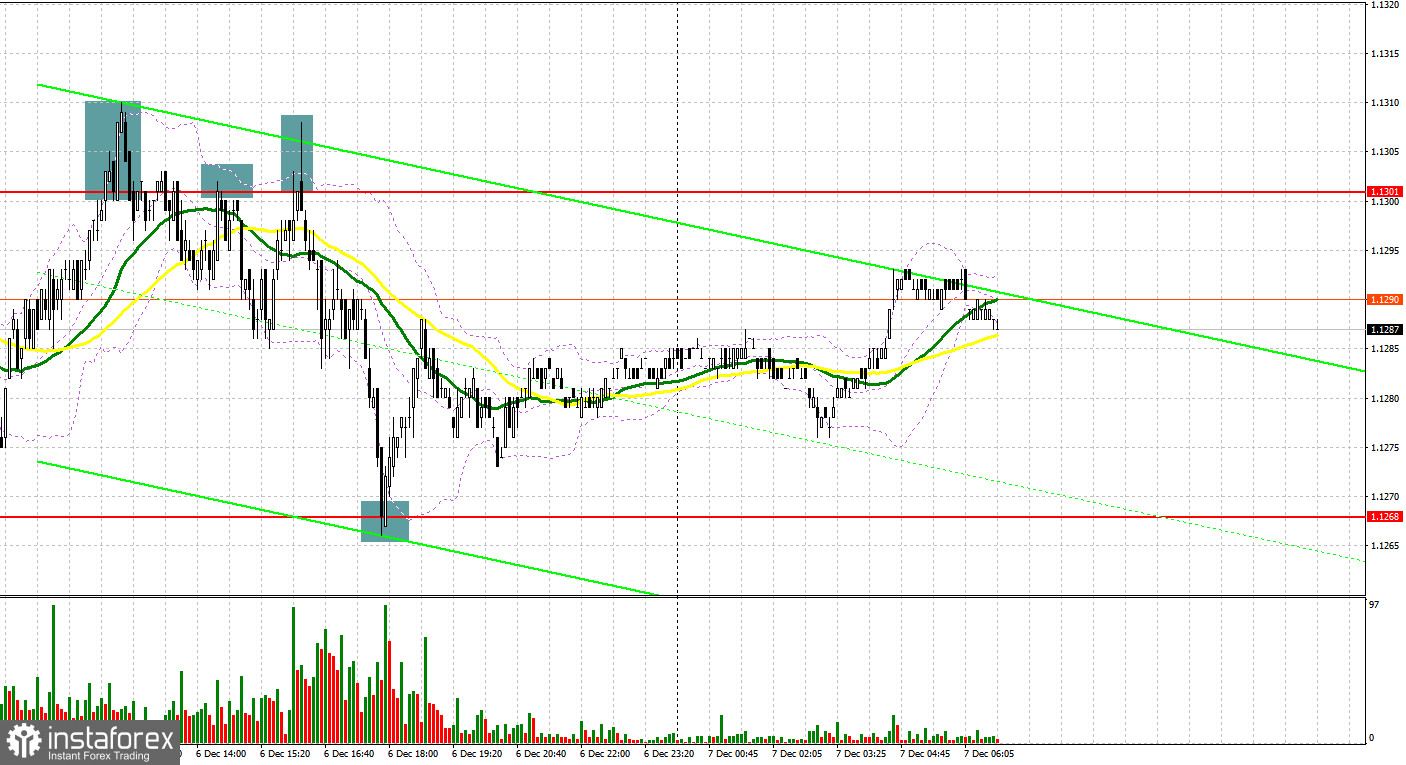
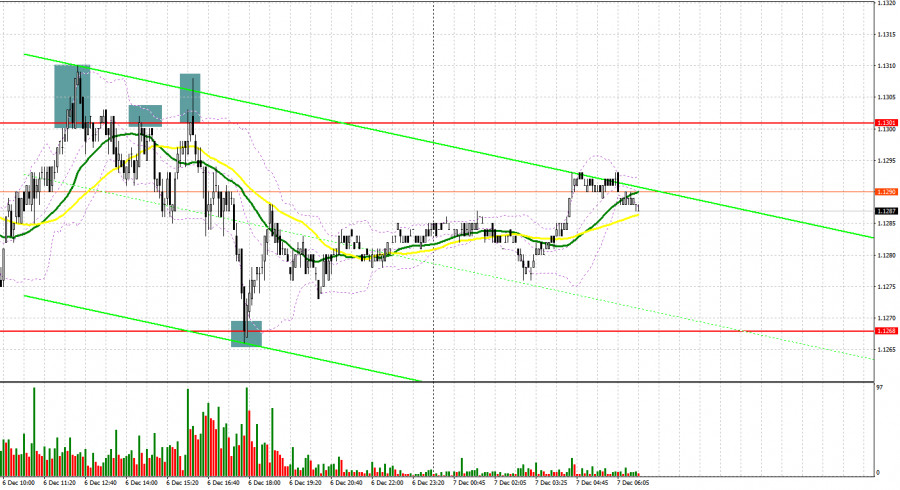
A fairly large number of signals to enter the market were formed yesterday. Let's take a look at the 5-minute chart and figure out the entry points. Even in my morning forecast, I drew attention to the 1.1301 level and recommended making decisions from it. The bulls' failure to break above the resistance of 1.1301 together with weak data on the European economy had led to the formation of a signal to open short positions, and so the euro fell by 15 points. During the US session, several similar false breakouts at 1.1301 increased the pressure on the euro and created new selling points, which ultimately resulted in a larger fall in EUR/USD to the 1.1268 area, allowing about 35 points to be taken from the market. A false breakout at 1.1268 and the fact that bulls protected this level provided an excellent entry point already into long positions. The growth was about 20 points.
Before we talk about the future prospects of the EUR/USD movement, let's look at what happened in the futures market and how the positions of Commitment of Traders have changed. The Commitment of Traders (COT) report for November 30 revealed a decrease in both short and long positions. However, the reduction of long positions still remained higher, which led to an increase in the negative delta. Last week there were a lot of speeches by Federal Reserve Chairman Jerome Powell, who in his comments spoke enough about the expected changes in monetary policy towards its tightening. The reason for this is rather high inflation, which has grown from "temporary" to permanent, which creates many problems for the central bank. The second problem was a new strain of the Omicron coronavirus, which will slow down the global economy at the end of this and early next year, which also restrains the demand for risky assets from bulls. The Fed will hold a meeting next week, at which a decision will be made on the bond purchase program, so demand for the US dollar is expected to remain in the shorter term. The latest November COT report indicated that long non-commercial positions declined from the level of 204,214 to the level of 191,048, while short non-commercial positions fell from the level of 220,666 to the level of 214,288. At the end of the week, the total non-commercial net position increased to -23,240 against -16,452. The weekly closing price, on the contrary, rose much to 1.1292 against 1.1241.
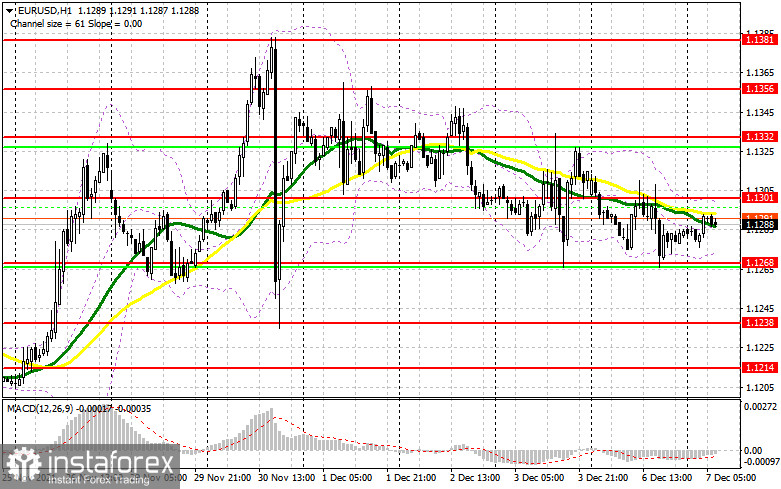
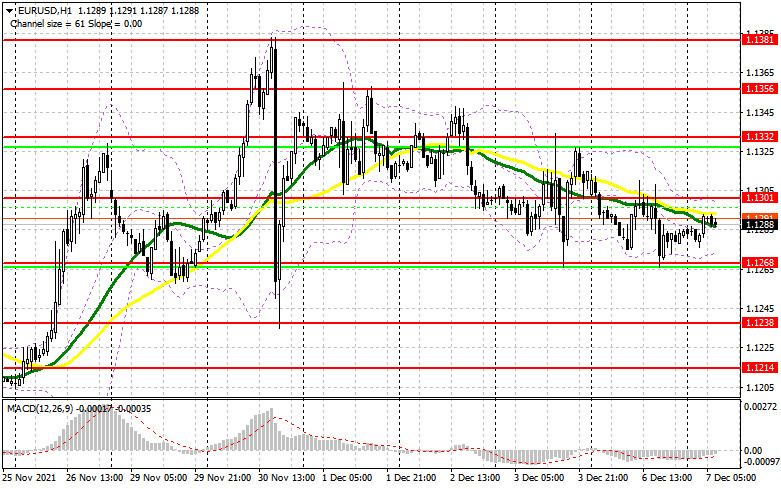
Today promises to be more interesting, as the bulls will seriously aim for the base of the 13th figure, above which it was not possible to break through yesterday. However, growth above 1.1301 should be supported by fundamental data on the European economy. Strong reports on the growth of the eurozone business sentiment index from the ZEW institute and the revised upside volume of the eurozone GDP for the third quarter of this year may lead to a breakthrough and consolidation above 1.1301, just below which are the moving averages playing on the side of the bears. The test of this level from top to bottom will provide an excellent entry point with the goal of returning EUR/USD to the area of the upper border of the horizontal channel at 1.1332, above which it was not possible to get above last Friday. A breakthrough of this range after a strong report on changes in the eurozone employment level will lead to a larger upward correction to the area of the weekly high of 1.1356, where I recommend taking profit. The next target will be the 1.1381 level. If the pressure on the euro persists in the first half of the day, and the reports on Germany and the eurozone disappoint traders, then it would be best not to rush into long position, but wait for the formation of a false breakout in the area of 1.1268, by analogy with yesterday, which I analyzed above. Only such a scenario will provide a good entry point into long positions. If the bulls are not active at this level, it is best to postpone selling until the larger support at 1.1238. I advise you to buy EUR/USD immediately on a rebound from the 1.1214 low, or even lower - around 1.1188 while aiming for an upward correction of 20-25 points within the day.
To open short positions on EUR/USD, you need:
So far, the bears are fulfilling all the tasks set before them, but their main goal for today is to protect the level of 1.1301, just below which the moving averages pass. Forming a false breakout there, similar to yesterday, and weak data for Germany and the eurozone will provide an excellent entry point for short positions, counting on the resumption of the bearish momentum observed last month. Bad news on the coronavirus will also put pressure on the euro, and a worsening situation with the number of infected people may lead to a larger drop in the pair. An equally important task for the EUR/USD bears is to regain control over the support of 1.1268, which was not done yesterday afternoon. This area is the lower border of the horizontal channel. Its breakdown and test from the bottom up will lead to the formation of a signal to open short positions with the prospect of a decline to the 1.1238 area. The next target will be support at 1.1214, where I recommend taking profit. If the euro grows and the bears are not active at 1.1301, it is better to wait with short positions. The optimal scenario will be short positions when a false breakout is formed around 1.1332. You can open short positions immediately on a rebound from the highs: 1.1356 and 1.1381 while aiming for a downward correction of 15-20 points.
Indicator signals:
Trading is carried out just below the 30 and 50 moving averages, which indicates an attempt by the bears to continue the fall of the pair.
Moving averages
Note: The period and prices of moving averages are considered by the author on the H1 hourly chart and differs from the general definition of the classic daily moving averages on the daily D1 chart.
Bollinger Bands
A breakthrough of the upper border of the indicator in the area of 1.1301 will lead to an increase in the euro. A breakout of the lower border of the indicator in the area of 1.1275 will increase the pressure for the pair.
Description of indicators
- Moving average (moving average, determines the current trend by smoothing out volatility and noise). Period 50. It is marked in yellow on the chart.
- Moving average (moving average, determines the current trend by smoothing out volatility and noise). Period 30. It is marked in green on the chart.
- MACD indicator (Moving Average Convergence/Divergence — convergence/divergence of moving averages) Quick EMA period 12. Slow EMA period to 26. SMA period 9
- Bollinger Bands (Bollinger Bands). Period 20
- Non-commercial speculative traders, such as individual traders, hedge funds, and large institutions that use the futures market for speculative purposes and meet certain requirements.
- Long non-commercial positions represent the total long open position of non-commercial traders.
- Short non-commercial positions represent the total short open position of non-commercial traders.
- Total non-commercial net position is the difference between short and long positions of non-commercial traders.