To open long positions on EUR/USD, we need the following conditions:
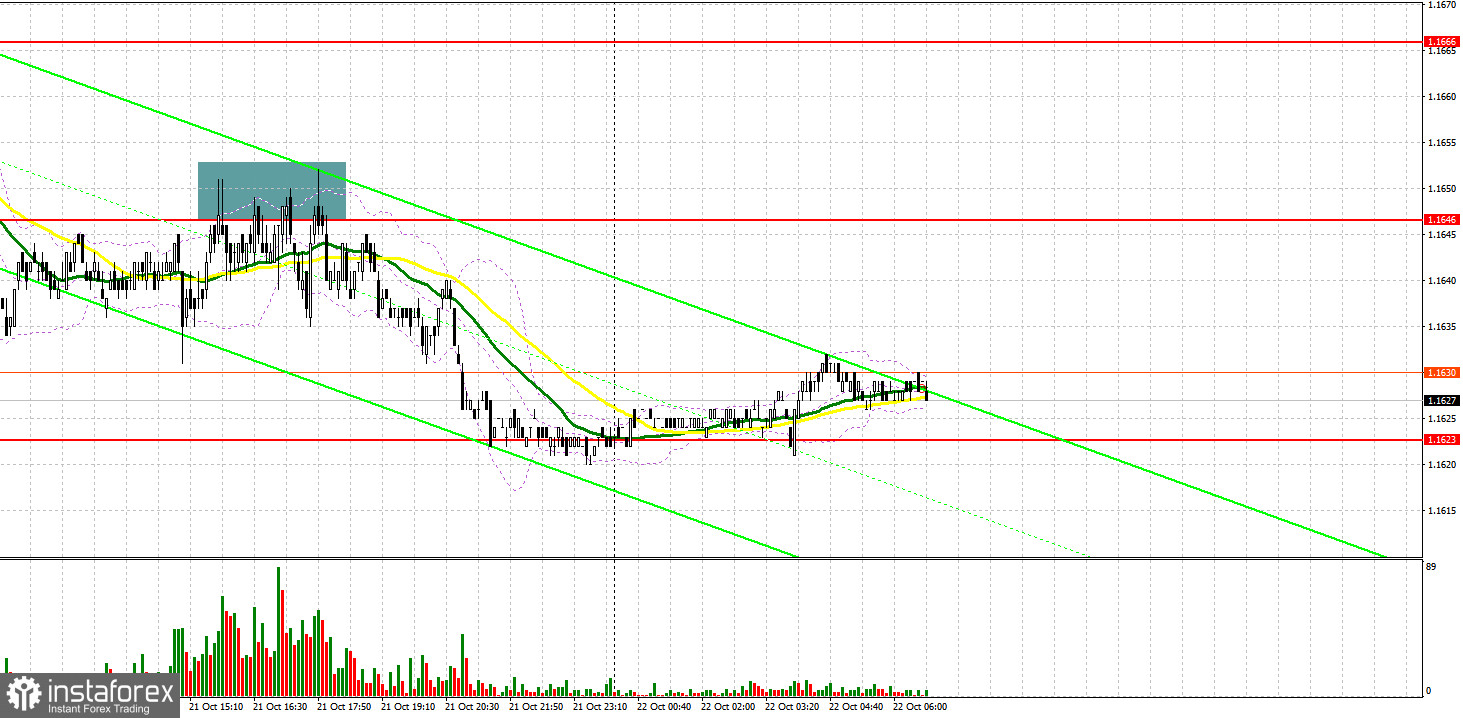
Yesterday, bearish sentiment on the euro/dollar pair prevailed. Importantly, bears asserted strength already in the Asian session. Let's look at the 5M chart and figure entry points. possible. In my forecasts, I drew attention to the support level of 1.1646 and recommended making decisions from this level. A breakout of this level gave a sell signal on the euro, pushing it to the next support level of 1.1623. However, the euro did not reach it. A similar situation occurred during the American session after the release of the positive initial jobless claims report. The formation of a false breakout at 1.1646 provided a good entry point into short positions. The target level was around 1.1623. So, traders were able to take more than 20 pips of profit.
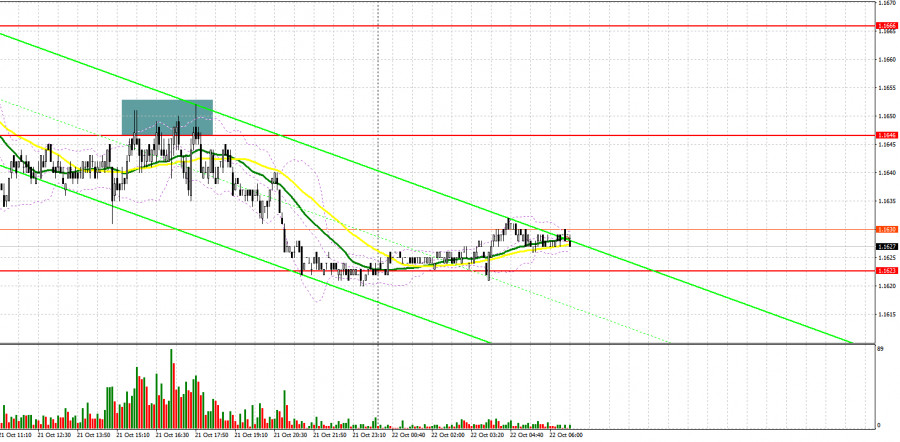
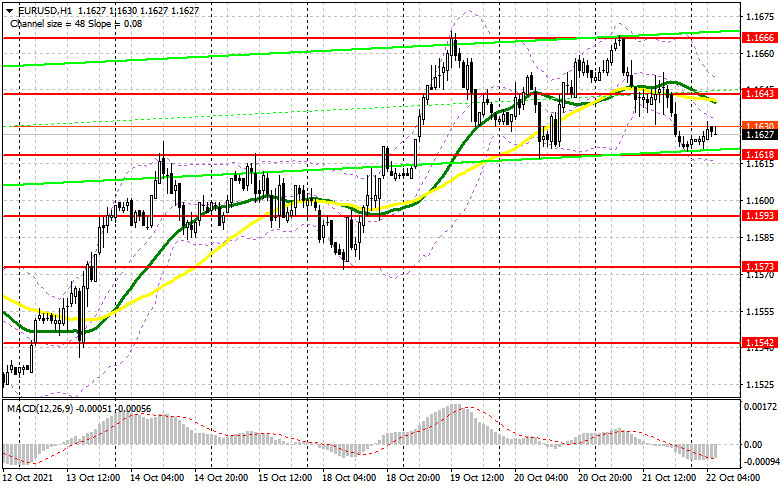
Today we are waiting for a batch of macroeconomic reports on the eurozone, namely the Services and Manufacturing PMI indexes. If this data turns out to be positive, the euro may regain ground. Yet, its growth may be restrained due to a new wave of the coronavirus pandemic. To recover, the euro/dollar pair needs to consolidate over the average border of the 1.1643 sideways channel. Yesterday, bulls failed to push the pair to this level. Only a breakout and consolidation above this range may give a buy signal. The euro is likely to rise to the upper limit of the channel at 1.1666. Only a breakout of this level will indicate strong bullish momentum on the pair that started in the middle of this month. After the test of 1.1666, the euro may grow to the 17th pattern. At this level, it is recommended to lock into profits. The next target is the 1.1716 level. If the pressure on the pair persists, bulls will have to defend the lower border of the 1.1618 sideways channel. The formation of a false breakout offers a good entry point into long positions. If there is no activity of bulls at this level, it is better to open long positions at 1.1593, or even lower at the low of 1.1573, counting on a rebound of 15-20 pips.
To open short positions on EUR/USD, we need the following conditions:
Bears were not very active today during the Asian session. They were holding the pair near the support level of 1.1618. The publication of important economic reports will trigger a surge in volatility in the market, which may affect the pair. The primary task of bears is to protect the middle of the 1.1643 sideways channel, where the moving averages are also passing below the bullish lines. Only the formation of a false breakout will increase pressure on the pair, pushing it to the lower limit of 1.1618. A signal to open short positions may appear amid a breakout and a test of this as well as weak data on the Services and Manufacturing PMI indexes of the eurozone. if so, it will also undermine long stop orders located below. If this scenario comes true, EUR/USD may nosedive to 1.1593 and to 1.1673, where it is recommended to lock into profits. A more distant target will be the 1.1542 level. A test of this range will mean a resumption of bearish sentiment for the euro. If there is no activity at the level of 1.1643, it is best to open short positions at the upper limit of the channel located at 1.1666. Open short positions for a rebound counting on downward correction of 15-20 pips from the high of 1.1691.
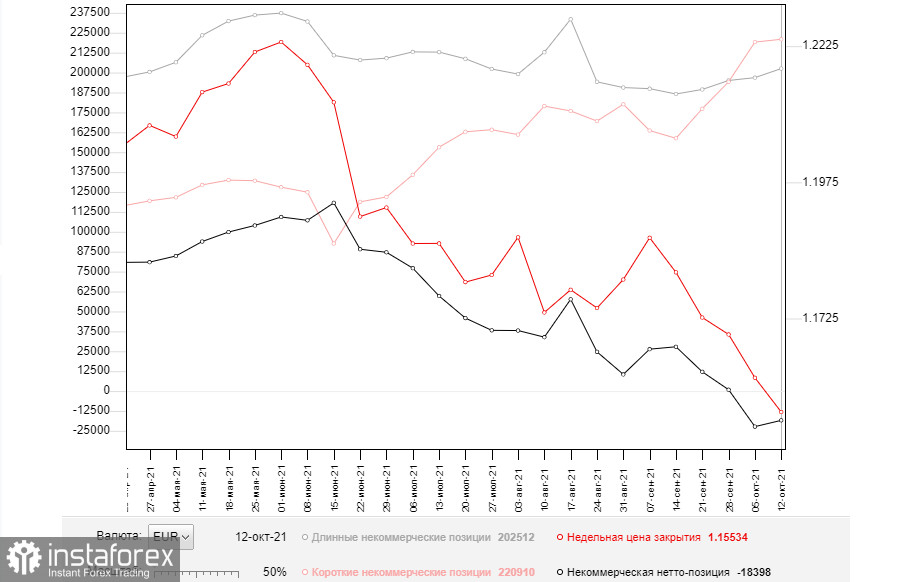
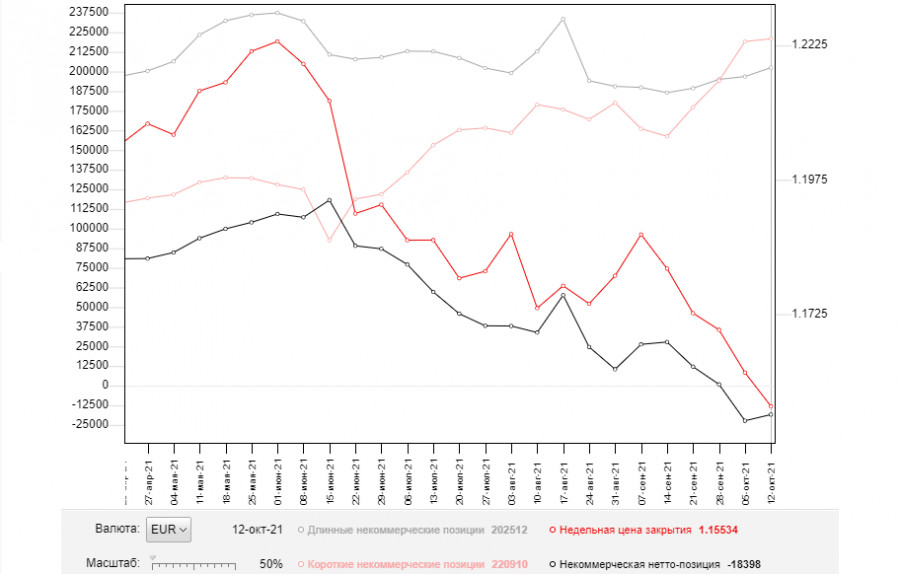
The COT report (Commitment of Traders) for October 12 showed an increase in both short and long positions. However, the volume of short trades turned out to be higher. Political headwinds in the United States have been eased. On top of that, recently published macroeconomic data was upbeat. So, the pace of the US economic recovery is buoyant. Besides, t the Fed is likely to taper bond purchases, which is bullish for the US dollar. ECB members expressed concerns about rising inflation. Yet, they did not make any hints about changes in monetary policy. This is why the European currency is gradually recouping its losses. This trend may continue in the future, especially in the case of strong economic reports on the European economy. However, medium-term demand for risky assets will remain limited due to the wait-and-see approach of the European Central Bank. The COT report indicates that long non-profit positions rose to 202,512 from 196,819, while short non-profit positions jumped to 220,910 from 219,153. At the end of the week, the total non-commercial net position increased slightly and amounted to 18,398 against 22,334. The weekly closing price dropped to 1.1553 against 1.16.
Indicator signals:
Moving averages
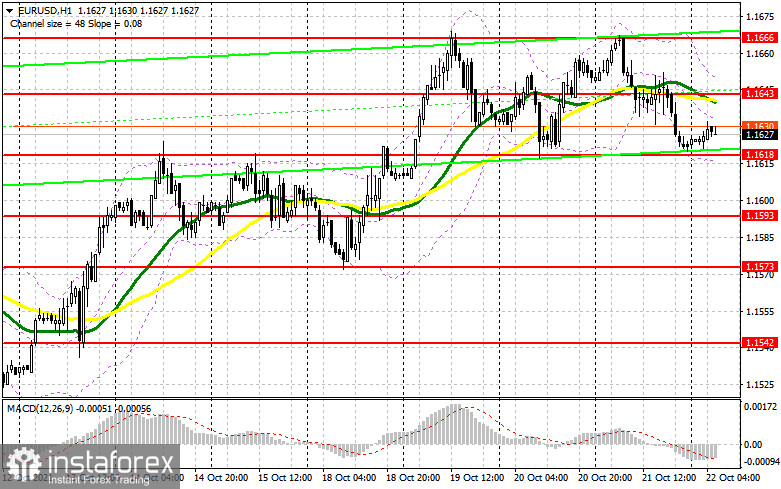
Trading is conducted below the 30 and 50 day moving averages, which indicates strong bearish momentum.
Note: Timeframes and prices of moving averages viewed by the author on the H1 chart differ from the general definition of the classic daily moving averages on the D1 chart.
Bollinger Bands
If the pair rises, the upper limit of the indicator around 1.1650 will act as resistance. The lower border of the indicator around 1.1615 will act as support.
Description of indicators
- Moving average (moving averages filter out the noise and make it easier to identify trends. Period 50. It is marked in yellow on the chart.
- Moving average (moving averages filter out the noise and make it easier to identify trends. Period 30. It is marked in green on the chart.
- MACD indicator (Moving Average Convergence/Divergence - convergence/divergence of moving averages) Fast EMA period 12. Slow EMA period 26. SMA period 9
- Bollinger Bands. Period 20
- Non-profit traders such as individual traders, hedge funds, and large institutions use the futures market for speculative purposes and meet certain requirements.
- Long non-commercial positions show the total number of long positions of non-commercial traders.
- Short non-commercial positions represent the total number of short positions of non-commercial traders.
- The total number of non-commercial net position is the difference between the short and long positions of non-commercial traders.