empty
22.10.2021 07:55 AM
Technical analysis of EUR/USD for European session, October 22. COT reports (analysis of yesterday's transactions). EUR to decline to 1.1618

To open long positions on EUR/USD, we need the following conditions:

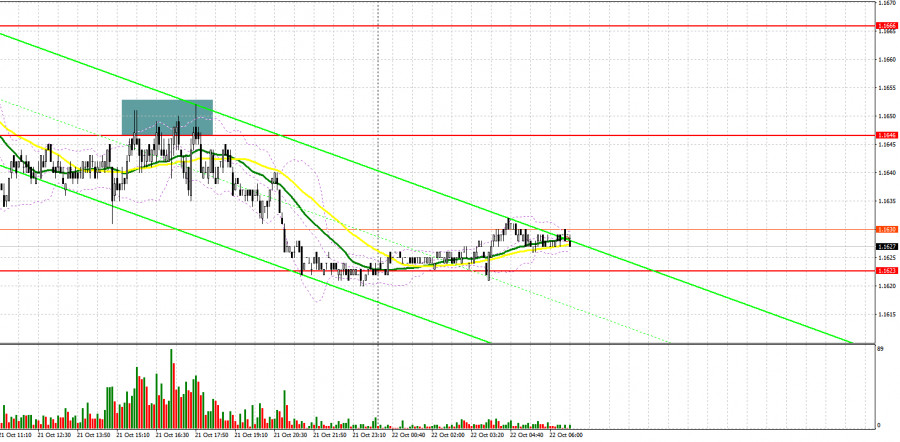
Yesterday, bearish sentiment on the euro/dollar pair prevailed. Importantly, bears asserted strength already in the Asian session. Let's look at the 5M chart and figure entry points. possible. In my forecasts, I drew attention to the support level of 1.1646 and recommended making decisions from this level. A breakout of this level gave a sell signal on the euro, pushing it to the next support level of 1.1623. However, the euro did not reach it. A similar situation occurred during the American session after the release of the positive initial jobless claims report. The formation of a false breakout at 1.1646 provided a good entry point into short positions. The target level was around 1.1623. So, traders were able to take more than 20 pips of profit.
This image is no longer relevant

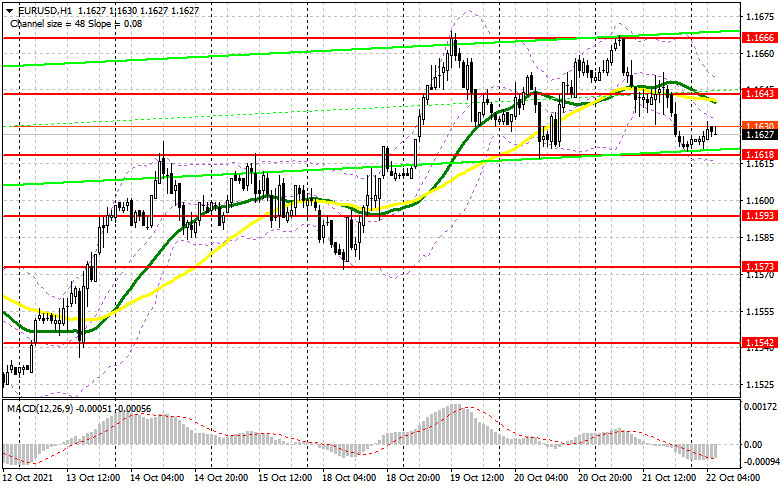
Today we are waiting for a batch of macroeconomic reports on the eurozone, namely the Services and Manufacturing PMI indexes. If this data turns out to be positive, the euro may regain ground. Yet, its growth may be restrained due to a new wave of the coronavirus pandemic. To recover, the euro/dollar pair needs to consolidate over the average border of the 1.1643 sideways channel. Yesterday, bulls failed to push the pair to this level. Only a breakout and consolidation above this range may give a buy signal. The euro is likely to rise to the upper limit of the channel at 1.1666. Only a breakout of this level will indicate strong bullish momentum on the pair that started in the middle of this month. After the test of 1.1666, the euro may grow to the 17th pattern. At this level, it is recommended to lock into profits. The next target is the 1.1716 level. If the pressure on the pair persists, bulls will have to defend the lower border of the 1.1618 sideways channel. The formation of a false breakout offers a good entry point into long positions. If there is no activity of bulls at this level, it is better to open long positions at 1.1593, or even lower at the low of 1.1573, counting on a rebound of 15-20 pips.

To open short positions on EUR/USD, we need the following conditions:

Bears were not very active today during the Asian session. They were holding the pair near the support level of 1.1618. The publication of important economic reports will trigger a surge in volatility in the market, which may affect the pair. The primary task of bears is to protect the middle of the 1.1643 sideways channel, where the moving averages are also passing below the bullish lines. Only the formation of a false breakout will increase pressure on the pair, pushing it to the lower limit of 1.1618. A signal to open short positions may appear amid a breakout and a test of this as well as weak data on the Services and Manufacturing PMI indexes of the eurozone. if so, it will also undermine long stop orders located below. If this scenario comes true, EUR/USD may nosedive to 1.1593 and to 1.1673, where it is recommended to lock into profits. A more distant target will be the 1.1542 level. A test of this range will mean a resumption of bearish sentiment for the euro. If there is no activity at the level of 1.1643, it is best to open short positions at the upper limit of the channel located at 1.1666. Open short positions for a rebound counting on downward correction of 15-20 pips from the high of 1.1691.
This image is no longer relevant

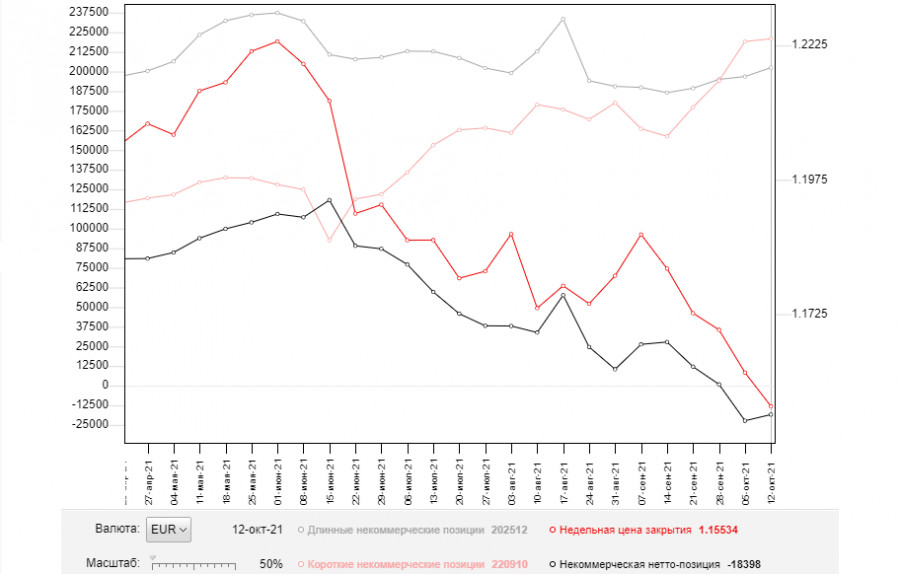
The COT report (Commitment of Traders) for October 12 showed an increase in both short and long positions. However, the volume of short trades turned out to be higher. Political headwinds in the United States have been eased. On top of that, recently published macroeconomic data was upbeat. So, the pace of the US economic recovery is buoyant. Besides, t the Fed is likely to taper bond purchases, which is bullish for the US dollar. ECB members expressed concerns about rising inflation. Yet, they did not make any hints about changes in monetary policy. This is why the European currency is gradually recouping its losses. This trend may continue in the future, especially in the case of strong economic reports on the European economy. However, medium-term demand for risky assets will remain limited due to the wait-and-see approach of the European Central Bank. The COT report indicates that long non-profit positions rose to 202,512 from 196,819, while short non-profit positions jumped to 220,910 from 219,153. At the end of the week, the total non-commercial net position increased slightly and amounted to 18,398 against 22,334. The weekly closing price dropped to 1.1553 against 1.16.
This image is no longer relevant

Indicator signals:

Moving averages

Trading is conducted below the 30 and 50 day moving averages, which indicates strong bearish momentum.

Note: Timeframes and prices of moving averages viewed by the author on the H1 chart differ from the general definition of the classic daily moving averages on the D1 chart.

Bollinger Bands

If the pair rises, the upper limit of the indicator around 1.1650 will act as resistance. The lower border of the indicator around 1.1615 will act as support.

Description of indicators

  • Moving average (moving averages filter out the noise and make it easier to identify trends. Period 50. It is marked in yellow on the chart.
  • Moving average (moving averages filter out the noise and make it easier to identify trends. Period 30. It is marked in green on the chart.
  • MACD indicator (Moving Average Convergence/Divergence - convergence/divergence of moving averages) Fast EMA period 12. Slow EMA period 26. SMA period 9
  • Bollinger Bands. Period 20
  • Non-profit traders such as individual traders, hedge funds, and large institutions use the futures market for speculative purposes and meet certain requirements.
  • Long non-commercial positions show the total number of long positions of non-commercial traders.
  • Short non-commercial positions represent the total number of short positions of non-commercial traders.
  • The total number of non-commercial net position is the difference between the short and long positions of non-commercial traders.
เลือกช่วงเวลา
5
นาที
15
นาที
30
นาที
1
ชั่วโมง
4
ชั่วโมง
1
วัน
1
สัปดาห์
รับผลกำไรจากการเปลี่ยนแปลงอัตราสกุลเงินดิจิทัลกับ InstaForex.
ดาวน์โหลด MetaTrader 4 และเปิดการซื้อขายครั้งแรกของคุณ.
ข่าวสารตลาดหุ้นสหรัฐประจำวันที่ 8 พฤษภาคม 2025 ดัชนีหุ้นสหรัฐปิดบวกด้วยความหวังในข้อตกลงการค้า ดัชนีหุ้นหลักของสหรัฐฯ ปิดการซื้อขายด้วยการเพิ่มขึ้น โดยได้แรงหนุนจากคำกล่าวของ Donald Trump เกี่ยวกับความคืบหน้าในการเจรจาข้อตกลงการค้า ตลาดต่างๆ ตีความว่านี่คือสัญญาณบวก นำไปสู่การดีดตัวของฟิวเจอร์สและความเชื่อมั่นของนักลงทุนที่ดีขึ้น อย่างไรก็ตาม การไม่มีรายละเอียดที่ชัดเจนทำให้นักวิเคราะห์ต้องระมัดระวัง โดยเตือนถึงความผันผวนที่อาจเกิดขึ้นหากการเจรจาล้มเหลว [อ่านเพิ่มเติมที่นี่] ธนาคารกลางสหรัฐฯ ยังคงอัตราดอกเบี้ยเงินกองทุน
  • Grand Choice
    Contest by
    InstaForex
    InstaForex always strives to help you
    fulfill your biggest dreams.
    เข้าร่วมการแข่งขัน


บทความแนะนำ

วิธีการเทรดคู่สกุลเงิน GBP/USD ในวันที่ 8 พฤษภาคม? เคล็ดลับง่ายๆ และการวิเคราะห์การเทรดสำหรับมือใหม่

คู่สกุลเงิน GBP/USD ไม่ได้แสดงการเคลื่อนไหวที่โดดเด่นในวันพุธ หลังจาก Jerome Powell กล่าวถึงความจำเป็นในการใช้เวลามากขึ้นในการประเมินผลกระทบทางเศรษฐกิจของภาษีที่ Donald Trump กำหนดขึ้น ค่าเงินดอลลาร์สหรัฐแข็งค่าขึ้นตามที่คาดการณ์ไว้ แต่ว่าการเติบโตนี้มากแค่ไหน? เพียงแค่ 50 pips

Paolo Greco 06:05 2025-05-08 UTC+2

วิธีเทรดคู่เงิน EUR/USD ในวันที่ 8 พฤษภาคม? เคล็ดลับง่ายๆ และการวิเคราะห์การเทรดสำหรับมือใหม่

คู่สกุลเงิน EUR/USD ยังคงเคลื่อนไหวอยู่ในช่องทางด้านข้างเมื่อวันพุธ ซึ่งสามารถมองเห็นได้บนกรอบเวลารายชั่วโมง ตามที่เราได้เตือนไว้ การประชุมของ Federal Reserve ไม่ได้เปลี่ยนแปลงอะไรเลย ในขณะที่เราเห็นการตอบสนองของตลาดเพียงเล็กน้อย ซึ่งไม่ได้มีผลกระทบจริงใดๆ ธนาคารกลางสหรัฐฯ ได้ตัดสินใจคงอัตราดอกเบี้ยสำคัญไว้ไม่เปลี่ยนแปลง และ Jerome

Paolo Greco 06:05 2025-05-08 UTC+2

คำแนะนำและการวิเคราะห์การซื้อขายสำหรับ GBP/USD ในวันที่ 8 พฤษภาคม: ปอนด์ไม่เห็นเหตุผลที่จะต้องตื่นตระหนก

เมื่อวันพุธ คู่สกุลเงิน GBP/USD ยังคงเคลื่อนไหวอยู่ในช่องข้าง ซึ่งมองเห็นได้ชัดเจนในกรอบเวลารายชั่วโมง ทั้งวันแทบไม่มีการเคลื่อนไหว และไม่มีเหตุการณ์พื้นฐานหรือเศรษฐกิจมหภาคเกิดขึ้น มีเพียงแต่ในช่วงเย็นเท่านั้นที่ผลการประชุมของ Federal Reserve กลายเป็นที่รู้จัก แต่เรายังไม่ทำการวิเคราะห์เพราะเชื่อว่าตลาดต้องการเวลาในการวิเคราะห์ข้อมูล ยังต้องทราบด้วยว่าผู้ค้าสถาบันในยุโรปไม่ได้มีโอกาสตอบสนองต่อการตัดสินใจของ Fed ในคืนวันพุธ

Paolo Greco 04:19 2025-05-08 UTC+2

คำแนะนำและการวิเคราะห์การซื้อขายสำหรับ EUR/USD ในวันที่ 8 พฤษภาคม: ความตื่นเต้นทั้งหมดได้ผ่านพ้นไปแล้ว

ในวันพุธ คู่สกุลเงิน EUR/USD ยังคงซื้อขายอยู่ในช่วงที่แคบเช่นเดิม ระดับ 1.1274 และ 1.1426 เป็นขอบเขตของช่องทางด้านข้างที่กว้างขึ้น ในขณะที่ช่วงที่แคบกว่าระหว่าง 1.1274 และ 1.1370 ตลอดทั้งวัน มีเพียงรายงานเดียวที่เผยแพร่ในเขตยูโรโซนและสหรัฐฯ

Paolo Greco 03:39 2025-05-08 UTC+2

GBP/USD: แผนการซื้อขายสำหรับช่วงสหรัฐอเมริกาในวันที่ 7 พฤษภาคม (รีวิวการซื้อขายในช่วงเช้า)

ในการพยากรณ์ช่วงเช้าของฉัน ฉันได้มุ่งเน้นไปที่ระดับ 1.3335 และวางแผนการตัดสินใจเข้าเทรดโดยยึดตามจุดนี้ มาดูกราฟ 5 นาทีและดูกันว่าเกิดอะไรขึ้น การทะลุและการทดสอบระดับ 1.3335 นำไปสู่การเข้าเทรดขายในสกุลเงินปอนด์ แต่คู่เงินไม่สามารถแสดงการลดลงที่สำคัญได้ ภาพรวมทางเทคนิคถูกแก้ไขใหม่สำหรับครึ่งหลังของวัน วิธีเปิดสถานะซื้อระยะยาวบน GBP/USD: ข้อมูล

Miroslaw Bawulski 19:39 2025-05-07 UTC+2

EUR/USD: แผนการซื้อขายสำหรับช่วงการซื้อขายในสหรัฐฯ วันที่ 7 พฤษภาคม (รีวิวการซื้อขายในช่วงเช้า)

ในคำพยากรณ์ช่วงเช้าของฉัน ฉันได้เน้นไปที่ระดับ 1.1379 และวางแผนที่จะใช้ระดับนี้ในการตัดสินใจเข้าสู่ตลาด มาดูกราฟ 5 นาทีเพื่อทำความเข้าใจว่าเกิดอะไรขึ้น การเพิ่มขึ้นและการเกิด false breakout ใกล้ระดับ 1.1379 ได้เป็นสัญญาณให้เข้าสถานะขายสำหรับยูโร ซึ่งส่งผลให้คู่สกุลเงินนี้ลดลงมากกว่า

Miroslaw Bawulski 19:36 2025-05-07 UTC+2

วิธีการเทรดคู่สกุลเงิน GBP/USD ในวันที่ 7 พฤษภาคม? เคล็ดลับง่ายๆ และการวิเคราะห์การเทรดสำหรับผู้เริ่มต้น

คู่สกุลเงิน GBP/USD แสดงการเคลื่อนไหวขึ้นอย่างเด่นชัดในวันอังคาร แม้จะยังคงอยู่ภายในกรอบด้านข้างที่อาจไม่ได้ชัดเจนสำหรับเทรดเดอร์ทุกคนก็ตาม อย่างไรก็ตาม บนกรอบเวลา 1 ชั่วโมงที่ปรับขนาดลง มองเห็นได้ว่าราคาซื้อขายอยู่ระหว่าง 1.3203 และ 1.3440 นับตั้งแต่วันที่ 16 เมษายน

Paolo Greco 06:55 2025-05-07 UTC+2

วิธีการเทรดคู่เงิน EUR/USD ในวันที่ 7 พฤษภาคม? เคล็ดลับง่ายๆ และการวิเคราะห์การซื้อขายสำหรับผู้เริ่มต้น

ในวันอังคาร คู่สกุลเงิน EUR/USD มีการซื้อขายคงที่ตลอดทั้งวัน เนื่องจากไม่มีรายงานหรือเหตุการณ์สำคัญใดๆ ทั้งในยูโรโซนหรือในสหรัฐฯ จึงแทบจะไม่มีโอกาสที่การเคลื่อนที่ในลักษณะคงที่นี้จะสิ้นสุดลง ความหวังเดียวก็คือการที่ Donald Trump อาจแนะนำการจัดเก็บภาษีใหม่หรือทำการตัดสินใจที่ส่งผลกระทบสูง อย่างไรก็ตาม Trump ได้งดเว้นจากการทำให้ความขัดแย้งทางการค้าทวีความรุนแรงขึ้นตลอดช่วงสามสัปดาห์ที่ผ่านมา และขณะนี้กำลังมองหาวิธีการในการกดดันให้จีนและสหภาพยุโรปลงนามในข้อตกลงการค้าตามข้อกำหนดของเขา

Paolo Greco 06:55 2025-05-07 UTC+2

คำแนะนำและการวิเคราะห์การซื้อขายสำหรับ GBP/USD วันที่ 7 พฤษภาคม: พาวด์ไม่เสียเวลา

ในวันอังคาร คู่สกุลเงิน GBP/USD ได้กลับมาเคลื่อนไหวขึ้นอีกครั้งอย่างกะทันหันและไม่คาดคิด ในขณะที่เงินยูโรยังคงติดอยู่ในตลาดที่แบน แต่เงินปอนด์อังกฤษกลับแสดงการปรับตัวเพิ่มขึ้นอย่างแข็งแกร่ง และอีกครั้ง โดยไม่มีเหตุผลที่ชัดเจน ต้องย้ำว่าในช่วงต้นสัปดาห์นี้ Trump ได้กำหนดอัตราภาษีใหม่ต่ออุตสาหกรรมภาพยนตร์ ซึ่งเป็นเหตุผลพื้นฐานที่ทำให้ค่าเงินดอลลาร์ลดลง แต่เงินดอลลาร์กลับไม่ได้ลดค่าลงเมื่อเทียบกับเงินยูโร และการกำหนดอัตราภาษีเกิดขึ้นในวันจันทร์ ไม่ใช่วันอังคาร

Paolo Greco 03:35 2025-05-07 UTC+2

คำแนะนำและการวิเคราะห์การซื้อขาย EUR/USD วันที่ 7 พฤษภาคม: ตลาดยังคงซบเซา

คู่สกุลเงิน EUR/USD ยังคงเคลื่อนไหวอยู่ในช่วงแคบแบบซ้ายขวาในวันอังคาร ซึ่งเป็นช่วงแนวราบภายในแนวราบอีกชั้นหนึ่ง ช่วงแนวกว้างที่สุดถูกกำหนดโดยระดับ 1.1274 และ 1.1426 และช่วงที่แคบกว่าคือจาก 1.1274 ถึง 1.1370 ไม่ว่าจะมองยังไง ตลาดก็ยังคงเป็นตลาดแนวราบ และเราก็อยู่ในตลาดแบบนี้มาสักพักแล้ว

Paolo Greco 03:35 2025-05-07 UTC+2
หากไม่สะดวกคุยในตอนนี้
ระบุคำถามไว้ได้ใน แชท.
Widget callback
 

Dear visitor,

Your IP address shows that you are currently located in the USA. If you are a resident of the United States, you are prohibited from using the services of InstaFintech Group including online trading, online transfers, deposit/withdrawal of funds, etc.

If you think you are seeing this message by mistake and your location is not the US, kindly proceed to the website. Otherwise, you must leave the website in order to comply with government restrictions.

Why does your IP address show your location as the USA?

  • - you are using a VPN provided by a hosting company based in the United States;
  • - your IP does not have proper WHOIS records;
  • - an error occurred in the WHOIS geolocation database.

Please confirm whether you are a US resident or not by clicking the relevant button below. If you choose the wrong option, being a US resident, you will not be able to open an account with InstaForex anyway.

We are sorry for any inconvenience caused by this message.