To open long positions on EUR/USD, you need:
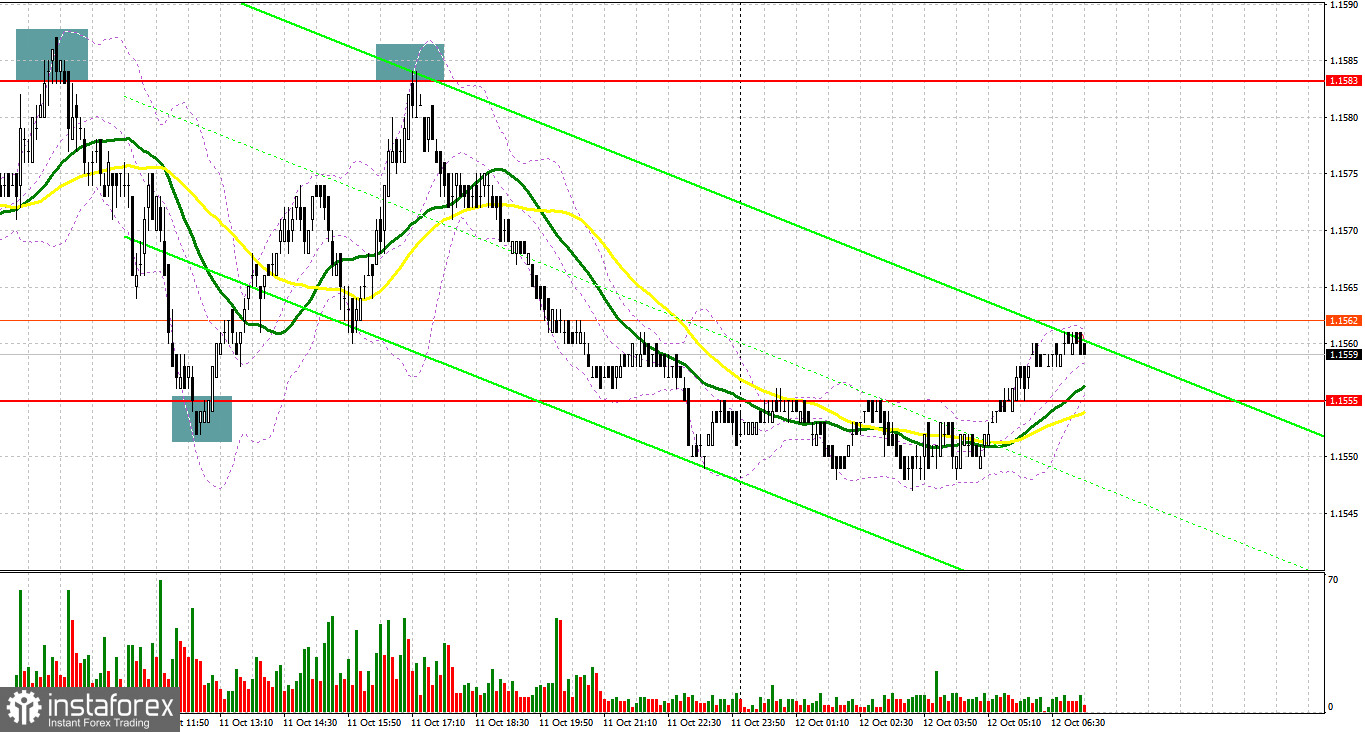
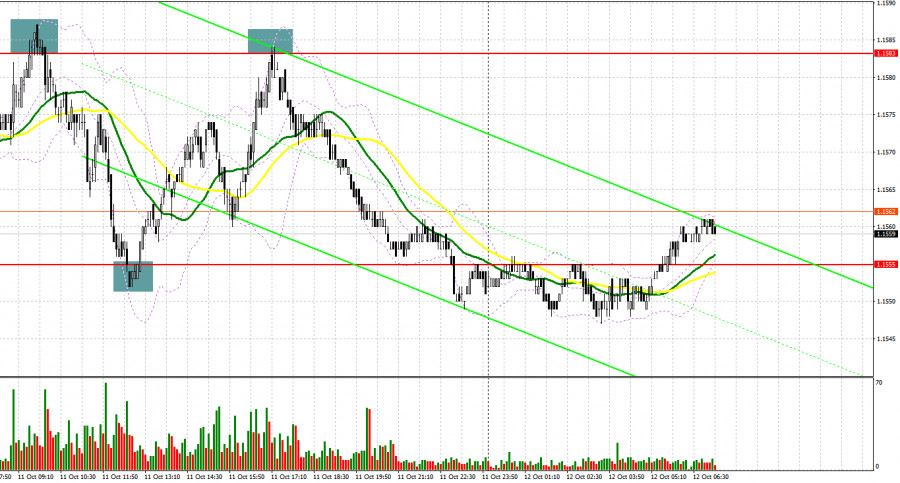
Quite a lot of signals to enter the market were formed yesterday. Although volatility remained low, they were all profitable. Let's take a look at the 5 minute chart and break down the entry points. Good data on industrial production in Italy helped the euro to slightly recover in the first half of the day, but active bears' actions returned the pressure to the market. The bears formed a false breakout at the level of 1.1583 at the beginning of the European session, which led to a signal to sell the euro and to a fall to the support area of 1.1558. Towards the middle of the day, the bulls were actively defending at this level, and a false breakout resulted in forming a signal to buy the euro. During the US session, another false breakout in the area of resistance at 1.1583 resulted in forming a signal to open short positions. As a result, the decline was about 30 points.
Before talking about the further prospects for the EUR/USD movement, let's see what happened in the futures market and how the Commitment of Traders positions have changed. The Commitment of Traders (COT) report for October 5 revealed a sharp increase in short positions and only a slight increase in long positions, which reduced the net position. A large increase in short positions only confirms the formation of a bear market for the European currency. Political problems in the United States, some of which have already been resolved at the moment, also affected the players' current positions in the report under consideration by the COT. Friday's report from the US Department of Commerce on the labor market (it is not taken into account in this COT report) most likely will not affect the balance of power between bulls and bears, as the data turned out to be rather ambiguous. All this only confirms the preservation of the bullish trend for the US dollar, which will be observed this week as well. The prospect of changes in the Federal Reserve's monetary policy as early as November of this year allows traders to build long dollar positions without much difficulty, as many investors expect the central bank to start cutting back on the bond buying program towards the end of this year. The demand for risky assets will remain limited due to the wait-and-see attitude of the European Central Bank. Last week, ECB President Christine Lagarde talked a lot about how she will continue to adhere to a wait-and-see attitude and keep the stimulus policy at current levels. The COT report indicated that long non-commercial positions rose from 195,043 to 196,819, while short non-commercial positions jumped quite seriously - from 194,171 to 219,153. By the end of the week, the overall non-commercial net position went into the negative zone and dropped from the level of 872 to the level of -22334. The weekly closing price also dropped to 1.1616 from 1.1695.
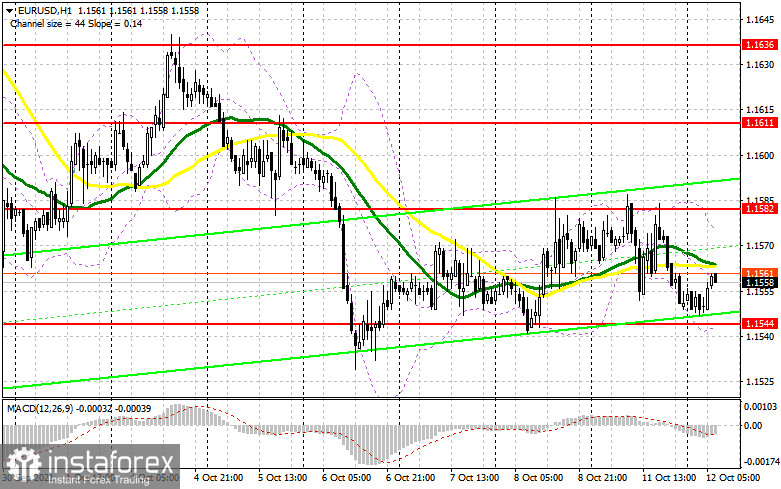
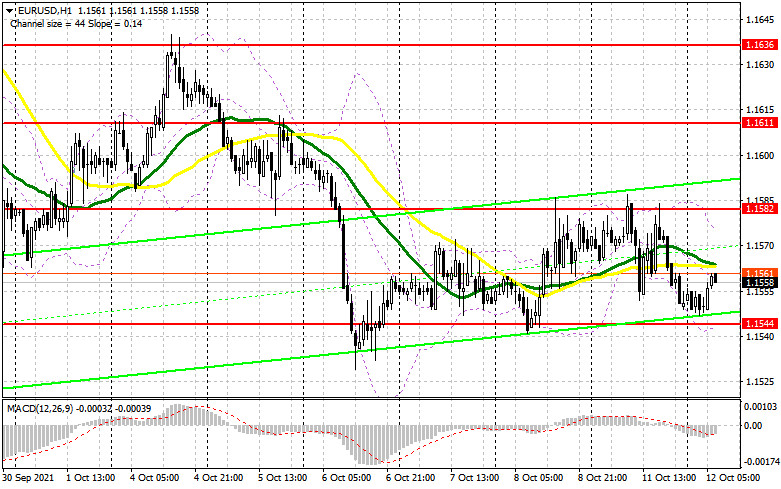
Today we are waiting for quite a variety of fundamental data that can both support the euro and put pressure on it. In the morning, attention will be drawn to the report on the index of business sentiment in Germany and the eurozone from the ZEW Institute. If the indicators do not reach economists' forecasts, most likely we will see a return of pressure on the euro during the European session. If the data turn out to be better than economists' forecasts, it will create some support for bulls, whose initial target is to break the level of 1.1582, which was not possible yesterday. Only a test of this area from top to bottom generates a signal to open long positions, counting on a recovery in the euro and a continuation of the upward correction, which is about to end. If this scenario comes true, we can expect the EUR/USD to rise to the 1.1611 area. Its breakthrough with a similar consolidation forms another buy entry point, which will lead the pair to new local levels: 1.1636 and 1.1659, where I recommend taking profits. If the pressure on the euro and weak data on sentiment in the business environment persist, long positions can only be opened if a false breakout is formed in the 1.1544 area. I advise you to buy EUR/USD immediately on a rebound only after the first test of the 1.1510 low, or even lower - from the level of 1.1482, counting on an upward rebound of 15-20 points within the day. A renewal in this area will be evidence of a renewed bearish trend.
To open short positions on EUR/USD, you need:
Bears are actively returning to the market, especially after they managed to defend the important resistance at 1.1582 twice yesterday. Today's fundamental data on the euro area could further exacerbate the situation and return the pressure on the euro, so it is better to stick to selling EUR/USD from large resistance levels. Forming a false breakout in the 1.1582 area will be one of such signals. This will provide an excellent entry point into short positions with the goal of pulling down the euro to the intermediate support of 1.1544. Only this level leaves a chance for the bulls to recover the euro. A breakthrough and test of this area from the bottom up will increase the pressure on the pair and open the way to the lows: 1.1510 and 1.1482, where I recommend taking profits. With the euro's growth and the bears are not active in the 1.1582 area in the first half of the day, I advise you to open short positions only after forming a false breakout in the 1.1611 area. Selling EUR/USD immediately on a rebound is best only after testing the new local resistance at 1.1636, counting on a downward correction of 15-20 points.
Indicator signals:
Moving averages
Trading is carried out just below the 30 and 50 moving averages, which indicates that the bears are trying to build a new downward trend.
Note: The period and prices of moving averages are considered by the author on the H1 hourly chart and differs from the general definition of the classic daily moving averages on the daily D1 chart.
Bollinger Bands
A breakthrough of the upper border of the indicator in the area of 1.1575 will lead to a new wave of euro growth. A breakout of the lower boundary at 1.1544 will increase the pressure on the pair.
Description of indicators
- Moving average (moving average, determines the current trend by smoothing out volatility and noise). Period 50. It is marked in yellow on the chart.
- Moving average (moving average, determines the current trend by smoothing out volatility and noise). Period 30. It is marked in green on the chart.
- MACD indicator (Moving Average Convergence/Divergence — convergence/divergence of moving averages) Quick EMA period 12. Slow EMA period to 26. SMA period 9
- Bollinger Bands (Bollinger Bands). Period 20
- Non-commercial speculative traders, such as individual traders, hedge funds, and large institutions that use the futures market for speculative purposes and meet certain requirements.
- Long non-commercial positions represent the total long open position of non-commercial traders.
- Short non-commercial positions represent the total short open position of non-commercial traders.
- Total non-commercial net position is the difference between short and long positions of non-commercial traders.