To open long positions on GBP/USD, you need:
Expectations that a trade agreement is about to be reached has provided support to the pound last Friday, but French President Macron said that they will block the deal if it didn't suit them, which caused the pound to fall and resulted in a larger profit taking on long positions by the end of last week.
Before examining the pound's technical picture and running to buy it, let's take a look at what happened in the futures market last week. Lack of clarity on the trade deal, along with the lockdown of the British economy, which was extended until mid-December, does not add optimism and confidence to buyers of the pound. However, expectation that the leaders will still be able to make concessions and find the necessary common ground on the key issue of fisheries leaves hope for the pound's successive growth. But time is running out, since they should have come to an agreement yesterday. The Commitment of Traders (COT) reports for November 24 indicates significant interest in the pound, as many traders hoped that the Brexit deal would be finalized. Long non-commercial positions rose from 30,838 to 37,087. At the same time, short non-commercial positions decreased from 47,968 to 44,986. As a result, the negative non-commercial net position was -7,899 against -17,130 a week earlier. This indicates that sellers of the British pound retain control and it also shows their slight advantage in the current situation, but the market is beginning to gradually come back to risks, and reaching a trade deal will help it in this.
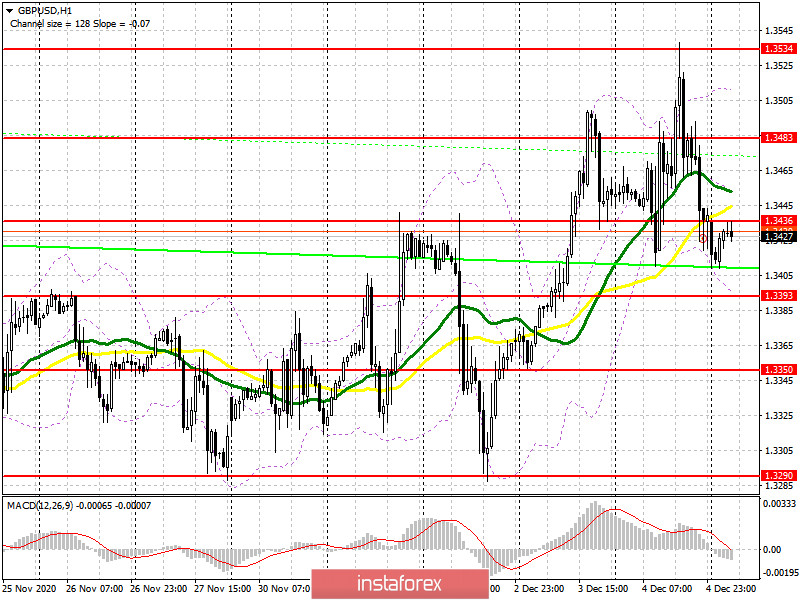
As for the technical picture of the pair, pound buyers should break through and get the pair to settle above the resistance of 1.3436, which they managed to miss in today's Asian session. Testing this range from top to bottom produces a fairly good signal to open long positions in anticipation of bringing back the bull market, which will lead to a test of the 1.3483 area, where I recommend taking part of the profit. The next task will be to update the high at 1.3534, where I advise you to leave long deals. If the pressure on the pound increases, and I expect that this will be the case at the beginning of that week, then forming a false breakout in the support area of 1.3393 will be a signal to open long positions. Otherwise, it is best to postpone long deals until a new low of 1.3350 has been tested, or open long positions immediately on a rebound from a strong support of 1.3290, which will be broken only if there is no agreement on Brexit this week.
To open short positions on GBP/USD, you need:
The initial task of the pound sellers is to return support at 1.3393 under their control. Getting the pair to settle below this range and testing it from the bottom up produces a good entry point into short positions, which will open a direct road to the 1.3350 low. Receiving negative news on the trade deal will surely pull down GBP/USD to the support area of 1.3290, which saved the pound from a major fall last week. The pound's succeeding direction depends if we break through this level, since there are a number of buyers' stop orders below, removing it will quickly pull down the pound to lows of 1.3194 and 1.3114, where I recommend taking profits. The longer the uncertainty about the trade agreement with the EU persists, the more it will weigh on the pound. If the bulls continue to push the pound up, it is best not to rush to sell, but wait until a false breakout forms in the resistance area of 1.3436 and open short positions only after that. I recommend selling GBP/USD immediately on a rebound from the high of 1.3483 or even higher from the resistance of 1.3534, counting on a downward correction of 20-30 points within the day.
Indicator signals:
Moving averages
Trading is carried out in the area of 30 and 50 moving averages, which indicates the sideways nature of the market.
Note: The period and prices of moving averages are considered by the author on the H1 hourly chart and differs from the general definition of the classic daily moving averages on the D1 daily chart.
Bollinger Bands
If the pair grows, the upper border of the indicator in the 1.3520 area will act as a resistance. A breakout of the lower border of the indicator in the 1.3393 area will increase the pressure on the pair.
Description of indicators
- Moving average (moving average, determines the current trend by smoothing out volatility and noise). Period 50. It is marked in yellow on the chart.
- Moving average (moving average, determines the current trend by smoothing out volatility and noise). Period 30. It is marked in green on the chart.
- MACD indicator (Moving Average Convergence/Divergence — convergence/divergence of moving averages) Quick EMA period 12. Slow EMA period to 26. SMA period 9
- Bollinger Bands (Bollinger Bands). Period 20
- Non-commercial speculative traders, such as individual traders, hedge funds, and large institutions that use the futures market for speculative purposes and meet certain requirements.
- Long non-commercial positions represent the total long open position of non-commercial traders.
- Short non-commercial positions represent the total short open position of non-commercial traders.
- Total non-commercial net position is the difference between short and long positions of non-commercial traders.