Analyzing Wednesday's trades:
EUR/USD on 30M chart
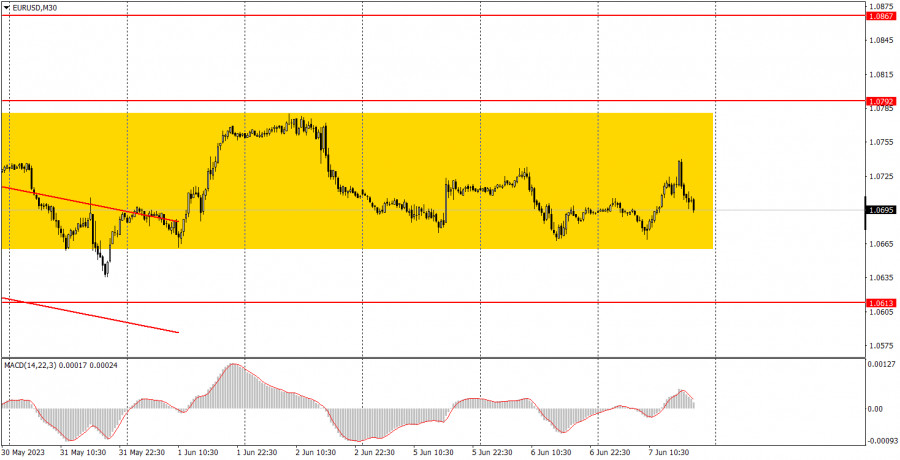
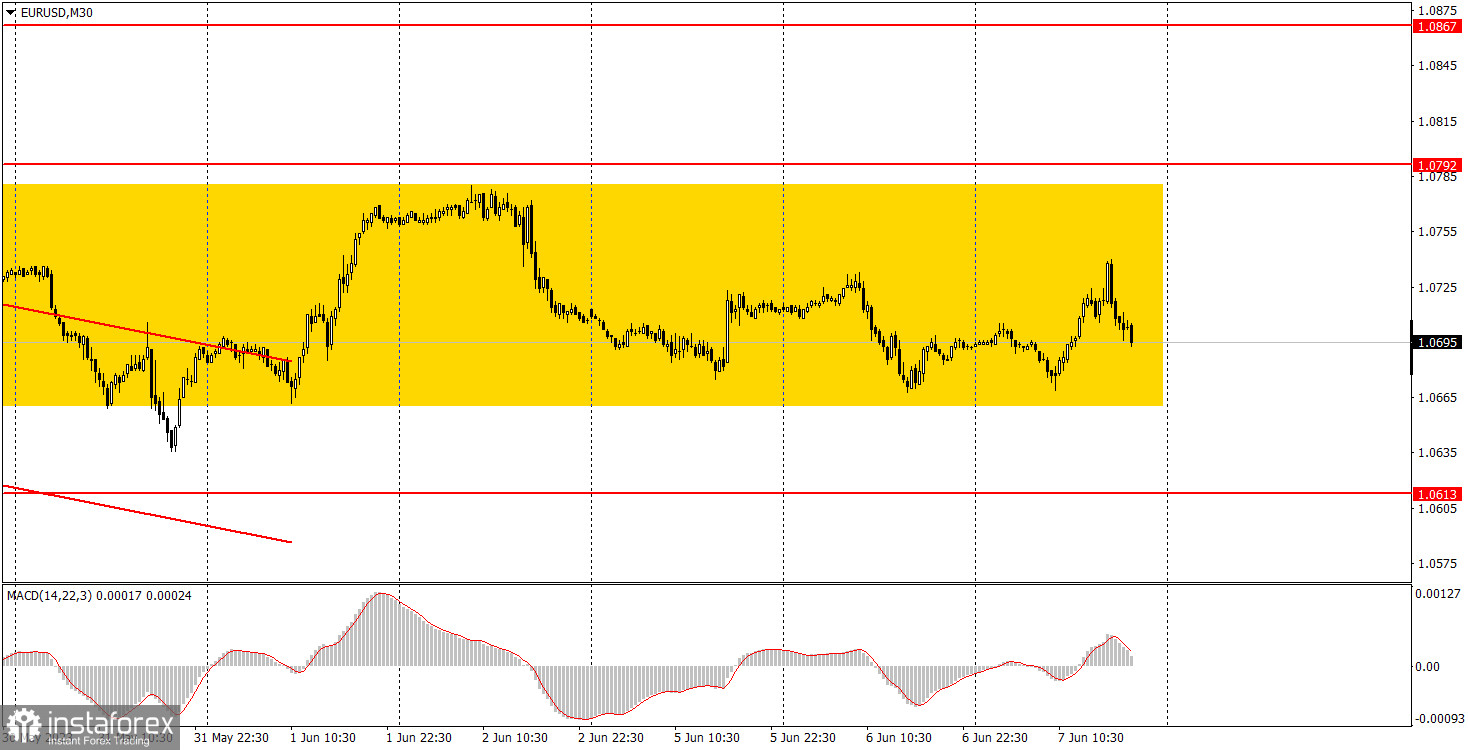
EUR/USD continued to trade within a limited price range on Wednesday, as we have been observing now for several consecutive days. We can't consider this as a classic flat, but the sideways price action has been persistent for two weeks now, with the channel boundaries looking vague. Therefore, the pair's movements weren't surprising. They were just completely random. There were no significant events in the US or the European Union throughout the day. The speech by European Central Bank Vice President Luis de Guindos did not provide any new information to the markets. It might seem like the euro's growth could have been triggered by something, but that is not the case. The pair can move in either direction without any news or reports. Furthermore, the chart below clearly shows a bounce from the level of 1.0673. So the movement was purely technical. It is difficult to say how long the pair will remain in this range. There are no important events or economic reports planned for this week.
EUR/USD on 5M chart
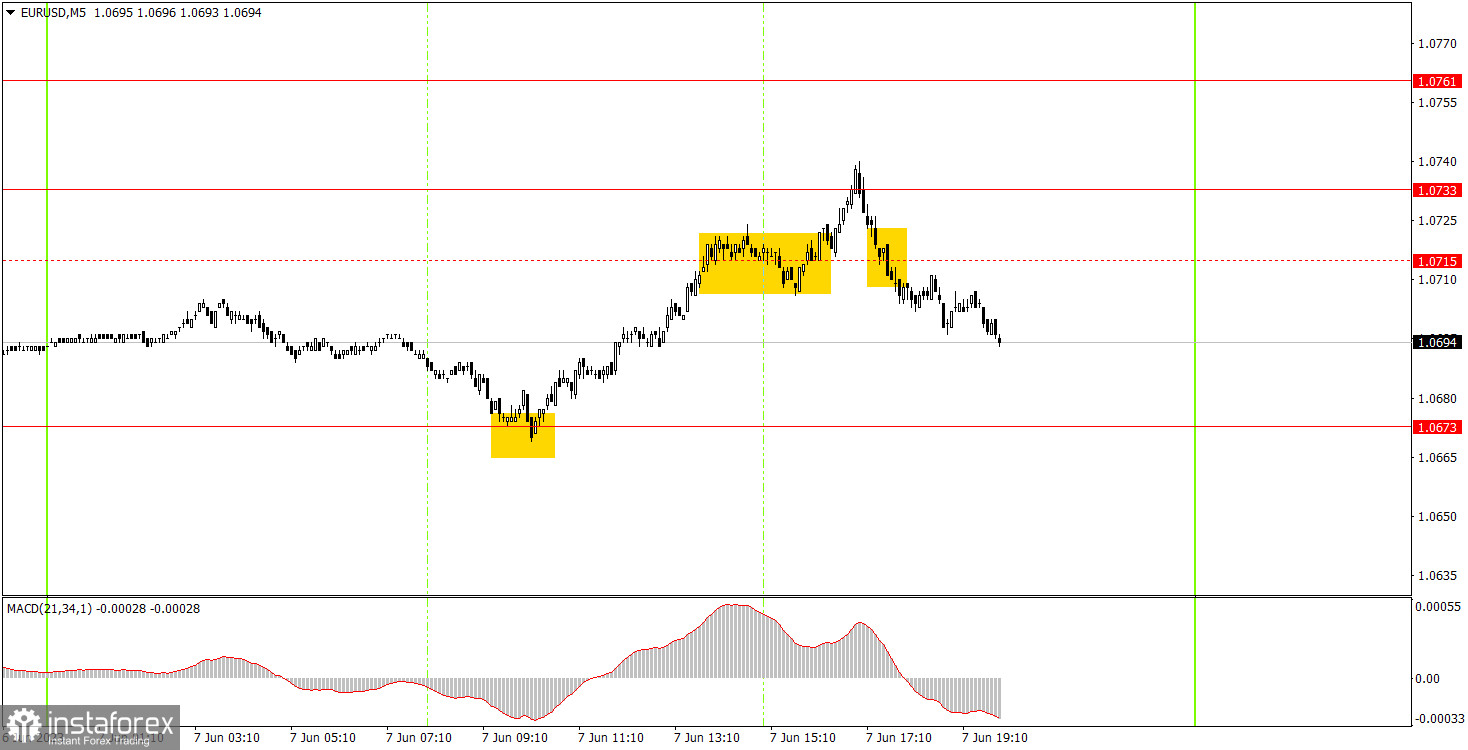
Three trading signals materialized on the 5-minute chart. Initially, the pair rebounded from the level of 1.0673, after which it managed to ascend by 55 pips, surpassing the 1.0715 level, which was removed from the charts by the end of the day. Instead, the 1.0733 level was added. Then the price held below 1.0715, after which the pair was able to exhibit a significant move in the correct direction for about 15 pips. You could have garnered an additional profit of 20 pips on the first buy position by closing it after the price held below 1.0715. You could have also earned 15 pips by manually closing the second sell position later on in the evening. As a result, it was a fairly good trading day, but it won't be like this every day - the movements are currently not the best, nor is the overall trend.
Trading tips on Thursday:
On the 30M chart, the pair indicates a slight inclination to terminate its descending trend, but for now, it is moving sideways more than up or down. In the medium term, we anticipate a resumption of the downward trend. However, it may take quite some time before the trend returns. The key levels on the 5M chart are 1.0517-1.0533, 1.0607-1.0613, 1.0673, 1.0733, 1.0761, 1.0792, 1.0857-1.0867. A stop loss can be set at a breakeven point as soon as the price moves 15 pips in the right direction. On Thursday, the European Union is set to release its GDP report for the first quarter in its third estimate. The headline for this report is "significant," but in reality, we are unlikely to see a strong market reaction. We will only see a reaction if the actual value deviates from the forecast. In the US, there is only a secondary report on unemployment claims.
Basic trading rules:
1) The strength of the signal depends on the time period during which the signal was formed (a rebound or a break). The shorter this period, the stronger the signal.
2) If two or more trades were opened at some level following false signals, i.e. those signals that did not lead the price to Take Profit level or the nearest target levels, then any consequent signals near this level should be ignored.
3) During the flat trend, any currency pair may form a lot of false signals or do not produce any signals at all. In any case, the flat trend is not the best condition for trading.
4) Trades are opened in the time period between the beginning of the European session and until the middle of the American one when all deals should be closed manually.
5) We can pay attention to the MACD signals in the 30M time frame only if there is good volatility and a definite trend confirmed by a trend line or a trend channel.
6) If two key levels are too close to each other (about 5-15 pips), then this is a support or resistance area.
How to read charts:
Support and Resistance price levels can serve as targets when buying or selling. You can place Take Profit levels near them.
Red lines are channels or trend lines that display the current trend and show which direction is better to trade.
MACD indicator (14,22,3) is a histogram and a signal line showing when it is better to enter the market when they cross. This indicator is better to be used in combination with trend channels or trend lines.
Important speeches and reports that are always reflected in the economic calendars can greatly influence the movement of a currency pair. Therefore, during such events, it is recommended to trade as carefully as possible or exit the market in order to avoid a sharp price reversal against the previous movement.
Beginners should remember that every trade cannot be profitable. The development of a reliable strategy and money management are the key to success in trading over a long period of time.