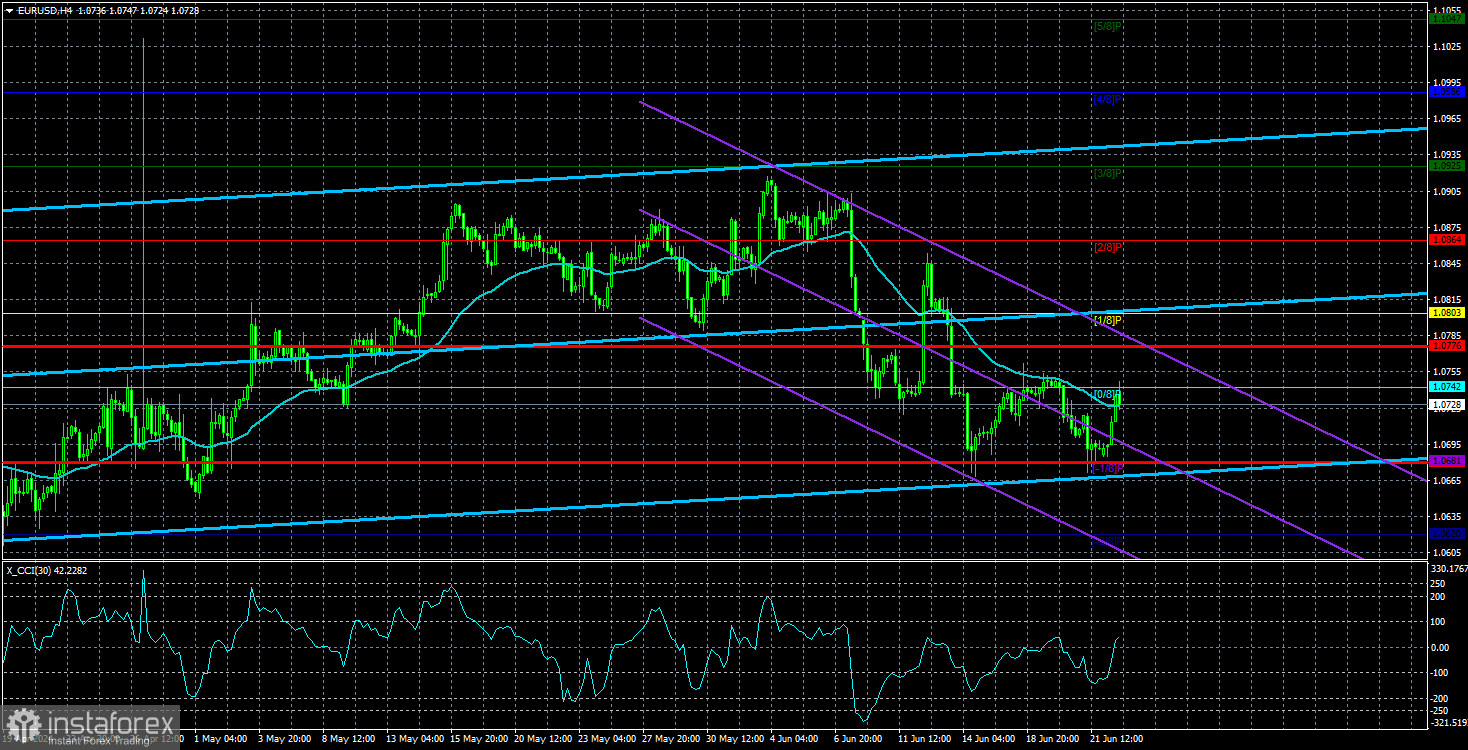
EUR/USD started to rise again from the Murray level "-1/8" - 1.0681. In previous articles, we mentioned that the euro could freely correct higher for another week or two. The point is that the pair's volatility remains quite weak. For instance, the average value over the last five days has been 45 pips. Therefore, it is completely unrealistic to expect a sharp decline or a sharp rise. At the same time, corrections are also not always simple - "single-wave". That is, if the pair is trading weakly and in a sluggish manner, it means that we will most likely see a complex corrective structure or even another flat. The price has tested the 1.0681 level twice and failed to break it twice. It is time to expect the pair to rise to the previous high of 1.0760.
The price may breach this high, but the euro has no strong fundamental and macroeconomic support. Therefore, it's also quite difficult to expect a strong growth in a downtrend (which is currently observed on the 4-hour and 24-hour timeframes). In this case, "strong" primarily means sharp. Therefore, the pair may correct higher to the Murray level "1/8" - 1.0803, but it may take quite a lot of time.
Let's move on to the fundamentals and macroeconomics. On Monday, there were no significant reports in the Eurozone or the US. There was nothing for the market to react to, and the upward movement had nothing to do with the minor reports that were scheduled for the day. In general, the fundamental background remains unchanged, and it is important to understand this. The global downtrend remains unchanged. Therefore, we expect the euro to decline.
It is worth noting that after the European Central Bank started lowering rates (unlike the Federal Reserve, from which everyone expected a rate cut back in March), the euro cannot help but be under market pressure. As we mentioned before, this does not mean that the pair will immediately plummet to price parity within a couple of weeks. The flow of capital is quite slow, and the EUR/USD pair is traditionally low in volatility. Therefore, we expect the current corrective wave to end between the levels of 1.0760 and 1.0803, which will maintain the current downtrend even on the 4-hour timeframe and provide opportunities for traders to look for entry points for short positions.
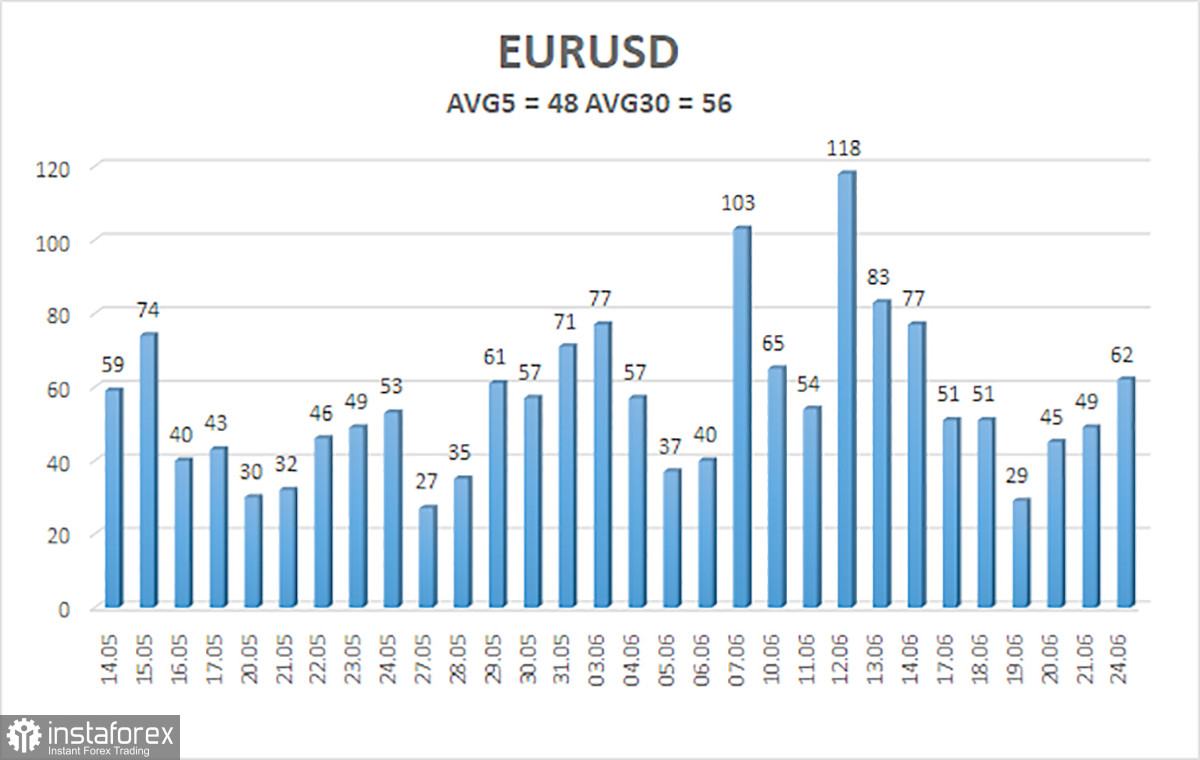
On Tuesday, we can also forget about the influence of fundamentals and macroeconomics. There will be no significant reports or speeches throughout the day. Therefore, nothing will prevent the pair from trading within its 40-50 pips per day in an upward, corrective channel. The higher linear regression channel may start to turn downward in the near future, which will only confirm the existing downtrend and its relevance. On the 24-hour timeframe, we still expect the pair to fall below the 1.0600 level.
The average volatility of the EUR/USD pair over the last five trading days as of June 25 is 48 pips, which is considered a low value. We expect the pair to move between 1.0680 and 1.0776 on Tuesday. The higher linear regression channel has turned upwards, but the global downtrend remains intact. The CCI indicator entered the oversold area, but we do not expect strong growth at this time.
Nearest support levels:
S1 - 1.0681
S2 - 1.0620
S3 - 1.0559
Nearest resistance levels:
R1 - 1.0742
R2 - 1.0803
R3 - 1.0864
Trading Recommendations:
The EUR/USD pair maintains a global downtrend, and it is located near the moving average on the 4-hour timeframe. In previous reviews, we said that we don't consider long positions and that we should wait for a continuation of the downtrend. At this time, short positions with targets at 1.0681 and 1.0620 remain valid. The rebound from 1.0681 triggered another round of the upward correction. We don't recommend buying the euro, as we believe that the global downtrend has resumed, and the single currency has no grounds for growth. But the price may rise within the correction for some time.
Explanation of the chart:
- Linear Regression Channels – Helps determine the current trend. If both are directed in the same direction, it means the trend is currently strong.
- Moving Average Line (settings 20.0, smoothed) – Determines the short-term trend and the direction in which trading should currently be conducted.
- Murray Levels – Target levels for movements and corrections.
- Volatility Levels (red lines) – The probable price channel in which the pair will spend the next day, based on current volatility indicators.
- CCI Indicator – Its entry into the oversold area (below -250) or the overbought area (above +250) means that a trend reversal in the opposite direction is imminent.