Bahagian ini memaparkan maklumat yang paling penting tentang perdagangan dengan InstaForex. Kami menyediakan kedua-dua analisis daripada pakar terkemuka untuk pedagang berpengalaman dan artikel mengenai syarat dagangan untuk pedagang baru. Perkhidmatan kami akan membantu meningkatkan potensi keuntungan anda.
Lihat juga
Bahagian ini dicipta untuk mereka yang baru memulakan perjalanan perdagangan mereka. Bahan pendidikan dan analisis InstaForex akan memenuhi keperluan latihan anda. Cadangan pakar kami akan menjadikan langkah pertama anda untuk kejayaan berdagang menjadi mudah dan jelas.
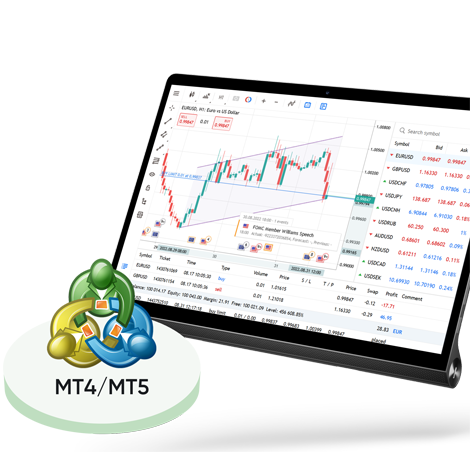
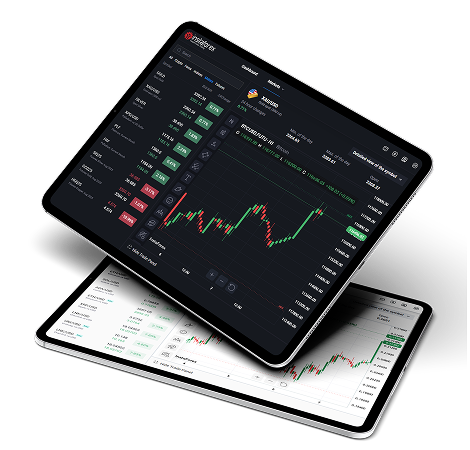
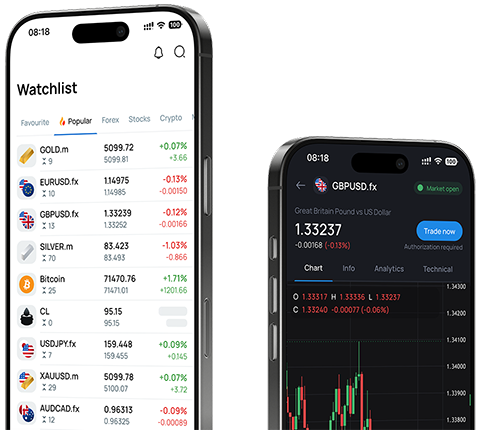
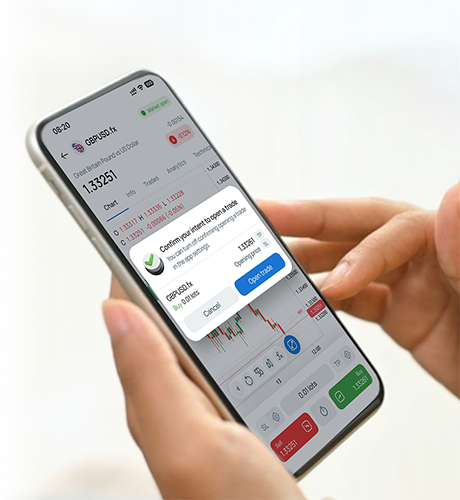
Perkhidmatan inovatif InstaForex adalah elemen yang penting dalam pelaburan produktif. Kami berusaha untuk menyediakan pelanggan kami dengan keupayaan teknikal lanjutan dan menjadikan rutin dagangan mereka selesa kerana kami diiktiraf sebagai broker terbaik dalam hal ini.
Kerjasama dengan InstaForex adalah yang paling menguntungkan dan bermanfaant. Sertai program afiliasi kami dan nikmati bonus, ganjaran rakan niaga dan peluang untuk mengembara bersama pasukan jenama terkenal dunia.
Bahagian ini mengandungi tawaran dagangan paling lumayan daripada InstaForex. Terima bonus apabila menambah akaun, bersaing dengan pedagang lain, dan dapatkan hadiah sebenar walaupun berdagang dalam akaun demo.
Percutian dengan InstaForex bukan sahaja menyenangkan tetapi juga sangat berguna. Kami menawarkan portal "one-stop", pelbagai forum dan blog korporat, di mana pedagang boleh bertukar-tukar pengalaman dan berjaya disepadukan ke dalam komuniti Forex.
InstaForex ialah jenama antarabangsa yang dicipta pada tahun 2007. Syarikat telah menyediakan perkhidmatan untuk perdagangan FX secara atas talian dan diiktiraf sebagai salah satu broker terkemuka dunia. Kami telah mendapat sokongan lebih daripada 7,000,000 pedagang, dimana mereka telah memberi sokongan dan pembaharuan.