


Trading on the international currency market became available to traders and investors in the early 1970s. Over more than 50 years of its existence, market participants have devised numerous methods for successful and profitable trading. By the way, we discussed various methods of working in the currency market and their nuts and bolts in the article titled "Trading Methods"
Some of these trading techniques have become so popular and effective that they gradually spread to other areas of human life. Today, we will talk about one such method of trading on Forex and in stock markets. Its name is the Fibonacci method. We will discuss its definition, history, applications, and advantages today.
Definition of Fibonacci Method
In a broad sense, it is a sequence of numbers that begins with 0 and 1, arranged so that each subsequent number is the sum of the two preceding ones.
To visually represent this magic, let’s scrutinize a Fibonacci numbers table, consisting of two columns. The number of rows in it will depend on how many numbers from the Fibonacci method the user needs to find.
For instance, if you need to find the ninth number in the sequence, use a table with nine rows; for the twelfth, a table with twelve rows, and so on.
However, you cannot find a random number without calculating all the previous ones. For example, to find the eighty-ninth number in the Fibonacci sequence, you must calculate all the numbers: from the first to the eighty-ninth.
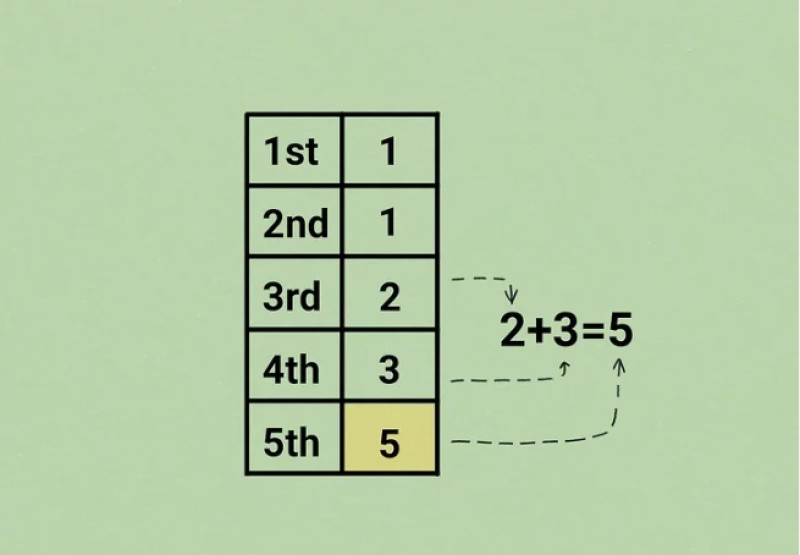
We will not go that far and will show you the principle using the example of finding the fifth number in the sequence. For this, in the left column, we put the sequential numbers of the sequence, i.e., starting from one, all the digits in order. They will determine the sequential numbers of the Fibonacci sequence. In our case, in the left column, we write 1, 2, 3, 4, and 5.
Next, in the first row of the right column, we write 1 – the first number from the Fibonacci method.
To the first number (1), we add 0. We get 1. This is the second number in the sequence.
Then we add the first and second numbers together to get the third: 1 + 1 = 2. The third entry in the Fibonacci table is 2.
Next, we add the second (1) and third (2) numbers to get the fourth: 1 + 2 = 3. Thus, the fourth number equals 3.
And finally, to obtain the fifth number of the sequence, which we need, we add the third (2) and fourth (3) members. As a result, the fifth number, which we sought after using the Fibonacci method, is 2 + 3 = 5.
History of Fibonacci method
The mystery of Fibonacci numbers was a matter of curiosity for the great sages of ancient India. Interestingly, at that time, trading did not exist even in theory. So, the number sequence was used entirely in the art of poetry.
Later, worldwide interest in this method was sparked by talented Italian mathematician Leonardo of Pisa, better known to his contemporaries as Leonardo Fibonacci. This occurred during the Renaissance, a period of truly monumental changes in the cultural life of European society.
Thanks to the openness of the people of that era to everything new and progressive, the Fibonacci sequence found its place in various spheres of life, from applied mathematics to architecture.
So, what was the genius innovation of Leonardo from Pisa? In his research work, he detailed a sequence representing an infinite series of numbers, each of which is the sum of the two preceding ones. In his book "Liber Abaci," Fibonacci supported his theory with the following example: 0, 1, 1, 2, 3, 5, 8, 13, 21, 34, 55 …
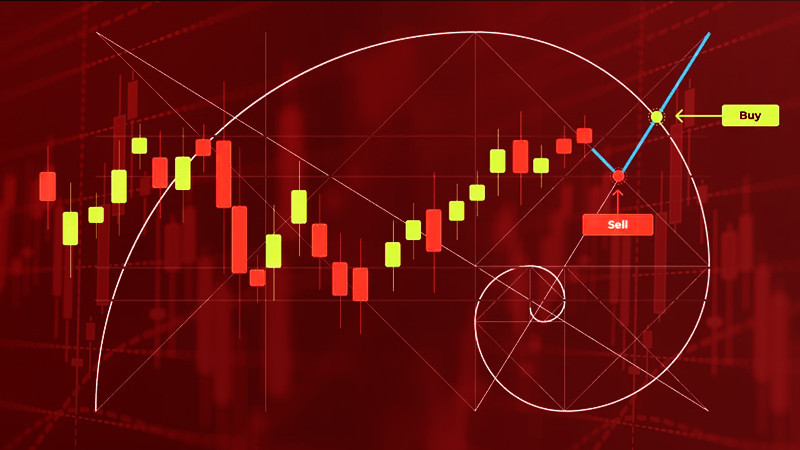
Visually, the ideal embodiment of this sequence became the Fibonacci Golden Spiral. It consists of arcs imbedded in squares, the dimensions of which correspond to the sequence of numbers mentioned above.
Why did this mathematical discovery so astonish the world and make everyone its admirer? During the Renaissance, such numerical findings appeared almost daily.
The reason lies in the fact that at the heart of the Golden Spiral is the Golden Ratio, a numerical proportion known since ancient times as 1.618. It was first mentioned in written sources in the 3rd century BC. At that time, the ancient Greeks used the Golden Ratio to construct a regular pentagon.
Interestingly, the Golden Ratio remains the most suitable proportion of a whole to its part even today. Somehow, the number 1.618 has become quite common in natural forms, which have nothing in common with each other.
The Golden Ratio can be seen in the shell of a snail, the spirals of a galaxy, or between the leaves on a branch. An excellent tool for studying this phenomenon is the pineapple fruit. More familiar to our climate is the pine cone whose spirals are arranged clockwise and counter-clockwise.
Specialists even note the presence of the Golden Ratio in the proportions of parts of our body. From all the above, it can be concluded that the theory of Fibonacci, and with it the Golden Ratio, were destined for success. Thanks to the genius of Leonardo from Pisa, they became popular not only among select ancient peoples in the field of poetry but also in the entire Western European culture. Today, the Fibonacci sequence is one of the most well-known principles of mathematical proportion and a unique phenomenon that artists eagerly use in their works.
How Fibonacci sequence was applied to trading
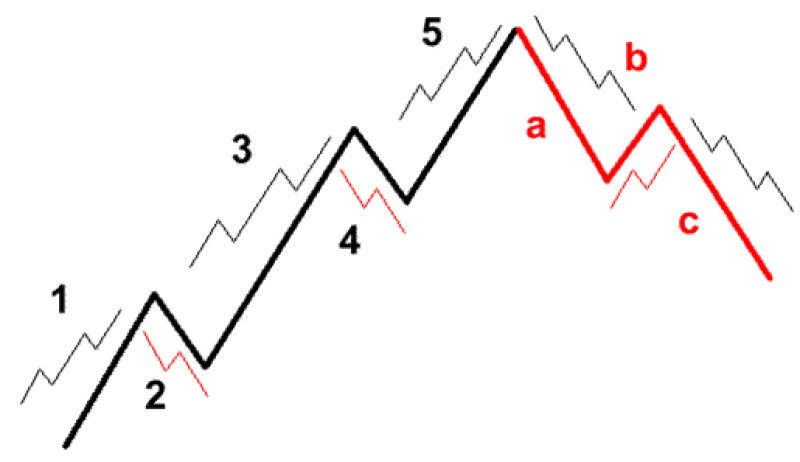
Let's return to the realm of trading in global financial markets. The idea of incorporating the Fibonacci sequence and the Golden Ratio into stock market trading belongs to the American financier Ralph Nelson Elliott. In the 1930s, he became so engrossed in analyzing stock market quotes that he began searching for the Golden Ratio in their charts.
Elliott meticulously studied hourly, daily, weekly, monthly, and yearly charts of stock indicators, covering more than a 70-year history of market fluctuations. His diligence bore fruit! He noticed that the movements of stock indicators adhere to unique waves, the proportions of which contain the very Golden Ratio – the number 1.618.
Initially, Elliott shared his discovery with the world of traders through several small works. Later, he dedicated an entire book to it, titled "Nature's Law – The Secret of the Universe." In it, he detailed all his findings related to Wave Theory and the Fibonacci method.
After the book was published in 1946, many traders worldwide began actively searching for various applications of the Fibonacci numerical sequence in financial market trading. Year after year, with the continuous development of computing technology, market players have been advancing further and more effectively in this direction. Today, traders use tools provided by Ralph Nelson Elliott and perfected by professionals for profitable and successful trading.
Principles of Fibonacci in trading
In the activity of trading in global financial markets, the Fibonacci method is considered a tool for measuring price movement. Later, based on these indicators, horizontal support and resistance levels are set on the chart.* Within the Fibonacci method, they are referred to as Fibonacci lines (levels). With these retracement and extension values, traders can analyze any asset, predict its future dynamic, and make the most accurate trading decision.
For effective trading, market players need clear price landmark levels. These can indicate to traders whether to buy, sell, or wait for the price to change its direction. However, not all market tools and strategies help in finding an exact answer to this question. This is where Fibonacci levels come into play, clearly showing traders which level will be effective and which one the price might skip without even noticing.
How does this method work in practice? Importantly, it is applied manually. Every trader, be it a novice or a market veteran, knows that when the price moves in a certain direction, it's easy to identify the start and end of the movement vector. The Fibonacci tool allows calculating the distance between these points.
According to the commonly accepted trading rule, Fibonacci levels should be stretched from the beginning to the end of the trend. Below you will find a chart illustrating the measurement of a descending trend using the Fibonacci method. We started applying the numerical pattern at the beginning of the price movement and finished at the end. Remember, in the case of a descending trend, it is always necessary to do this from left to right.
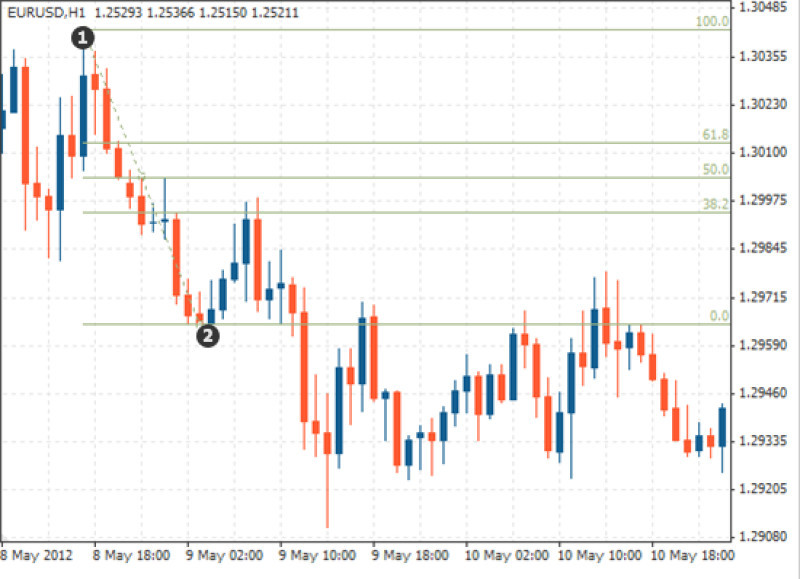
Next, the principle of the Fibonacci method is an ascending price movement on the chart. Here, we apply the pattern moving from the bottom point to the top, again from left to right. After stretching the tool, the resulting levels become potential targets for correction. However, it would be a serious mistake to limit the use of the Fibonacci tool only to determine support or resistance levels. Using this method, market players can successfully predict so-called extension levels, which indicate the direction in which the price is likely to move. Thus, Fibonacci extension levels can be quite effectively used for profit-taking. To maximize the level of income, these levels can be correlated with the corresponding correction levels.
*Support and resistance levels are horizontally positioned lines constructed along the price's lows or highs.
Drawbacks of Fibonacci method
Despite Fibonacci levels being a truly excellent solution for trading, it's important to understand that they are not a cure-all. Before you start applying this trading technique in your strategies, we recommend you thoroughly study all its features, capabilities, and drawbacks.
For instance, in real trading, it's not uncommon to encounter situations where Fibonacci levels simply do not work. After all, the price of an asset is capable of breaking through both resistance and support. Thus, it can certainly also break through Fibonacci lines.
At this point, it becomes clear that the aforementioned numerical pattern is more of a hint-helper rather than a hundred percent guarantee of price pullbacks and retracements.
Moreover, you should remember that Fibonacci lines are only applicable in the presence of a clear-cut trend. If applied to an instrument which is trading in a range-bound market, the levels will be less accurately operative, and their use is unlikely to bring long-term profit to the trader.
The efficiency of applying Fibonacci levels also considerably decreases when the correction phase lasts too long. Despite this, the correction levels here will still be relevant and capable of functioning in a mirrored manner. Hence, the conclusion: Fibonacci levels, like any other tool in technical analysis*, require detailed and careful refinement, constant adjustments, and ongoing filtration.
Traditionally, technical analysis is based more on probabilities than guarantees, meaning the asset price will not always interact with its tools (including Fibonacci levels) in the way a trader would like.
Moreover, sometimes the price completely ignores these levels, independently choosing more or less significant key lines at any given time. Thus, the Fibonacci methodology in trading is difficult to call an objective tool. However, it is definitely always important to have it in your trading arsenal.
Another working idea could be to combine the Golden Ratio with standard levels, for example, with classical support and resistance lines. Additionally, Fibonacci can be effectively combined with trend lines, auxiliary indicators, or Japanese candlesticks.
Undoubtedly, by experimenting with various technical analysis techniques, traders can significantly expand their possibilities for making profitable trades. Using as many of these helpers as possible in their trading, market players can create a truly successful trading strategy that helps them easily adapt to any changes and peculiarities of market conditions.
It's important to understand the following: despite the Fibonacci pattern and the Fibonacci numbers table being based exclusively on precise mathematical calculations, they do not provide a hundred percent guarantee of success in transactions in global financial markets.
To minimize risks and safeguard oneself from losses, every trader needs to turn to fundamental analysis. It helps determine what is happening in the market at any given time, as well as constantly focusing on factors that can influence price movement.
After all, the value of an asset is not some artificially created indicator. It's a real representation of supply and demand. The latter, in turn, is heavily dependent on the economic and political sentiments prevailing in the world. For instance, significant fluctuations in currency pairs can be caused by changes in the credit and monetary policies of states, investor reactions to the latest economic and geopolitical events, news background, fresh macroeconomic statistics of countries, and also wars, pandemics, and climatic disasters.
Thus, despite certain regular patterns, which the Fibonacci numerical sequence helps to reveal, the market is always influenced by factors that are not subject to strict mathematical laws. However, when external influences on the markets are minimal, the use of trading tools based on the aforementioned method can indeed accurately predict the behavior of securities, indices, and currency quotes.
*Technical analysis is a set of tools that allow a trader to assess the current situation in the financial market and predict its possible change by identifying statistical patterns of asset price movements.
The Fibonacci method is most commonly encountered in the realm of art. The famous Golden Spiral, based on the Fibonacci number sequence, serves as an ideal foundation for constructing proportions and artistic composition. The Golden Ratio helps creators in producing masterpieces in painting, sculpture, and architecture. Perhaps the most renowned example that each of us has undoubtedly seen is the works of the Italian artist Leonardo da Vinci.
If not delving too far into history while remaining in the sphere of art, the Golden Ratio is actively used today by photographers and filmmakers as a convenient model for harmoniously positioning objects within a frame.
Specialists in 3D modeling and web design also utilize this method. In computer graphics, the Fibonacci sequence is applied to construct self-similar figures: crystals, branches and roots of trees, rivers, and lakes.
Moreover, using the Golden Ratio, web designers make the layout of website pages visually appealing and user-friendly. Jewelers often turn to the Fibonacci grid as well. This tool helps them to place points on two-dimensional or three-dimensional objects in the process of performing high-precision cutting of precious stones.
Besides, recursive algorithms, of which the Fibonacci number sequence is a prime example, are actively used in the field of computer science and programming to simplify mathematical calculations. The ability to use the aforementioned algorithms is one of the key requirements for every programmer. Often, as a test task during interviews for programming positions, applicants are asked to calculate Fibonacci numbers.
Simulation modelling is another contemporary field that cannot be done without the Fibonacci method. Using this pattern, specialists in crystallography model the growth of crystals.
The laws of Fibonacci are also frequently used in modern science. Analysts use the numerical sequence to describe various social, economic, and natural processes, which contain a multitude of factors that make research results unpredictable.
Conclusion
We hope that through this article, you have come to appreciate the unique tool, the Fibonacci method. We have tried to showcase its merits from every angle, to demonstrate the boundless possibilities of this phenomenon. It goes without saying that the Fibonacci number sequence embellishes the world around us in every aspect.
However, enough of the lyricism, we are all here to find the most convenient, simple, and effective trading methodology. In this regard, the law of Fibonacci and the Fibonacci numbers table are even more unique gems than in the fields of painting, science, crystallography, or design. This is because the foundation of this system is precise mathematical calculations, which means the method is free from emotions and impulsive careless actions. Apparently, this fact significantly increases the probability of making profitable trades.
Another important proof of the value of the Fibonacci method for trading in financial markets is its relevance. Despite the fact that the Fibonacci method was discovered over 90 years ago, traders eagerly apply it even today. Moreover, market players are constantly improving their trading using this pattern to earn even greater profits. Finally, the most significant advantage of the Fibonacci methodology is its simplicity of use. Both market newcomers and experienced traders can easily master it. The tremendous popularity of the tool among asset traders worldwide is proof of this.
You may also like:


