


In the world of finance, everyone aims to make accurate decisions based on current trend analysis.
In today's fast-paced world, where each moment brings an overwhelming amount of new information, it is essential to sift through this vast array of information to identify the most crucial and relevant data.
You can also read "Trading Methods".
Various tools and analysis methods can help you do this. The moving average method is one such tool. It has become indispensable for many traders, analysts, and investors worldwide. This mathematical method identifies the general market trend by filtering out noise or short-term price fluctuations. It is a simple-to-learn technical indicator that provides a clear and visual representation of the market movement.
In this article, we will focus on what the moving average is, its types, how it is calculated, and how it could be applied. We hope that this information will be useful and allow you to approach the intricacies of financial analysis with greater confidence. We also recommend the useful article "Forex (Fx) Trading Methods".
Moving Average Method
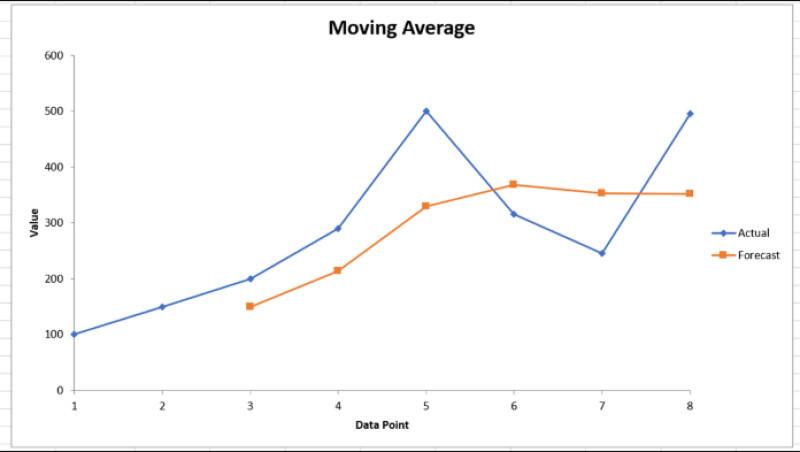
The moving average (MA) is a mathematical tool used for analyzing time series by creating a sequence of average values from subsets of this data. Simply put, it is a way to highlight the main trend from data that may be subject to short-term fluctuations.
Imagine an ocean with waves representing short-term changes, while the underlying currents, akin to our line, determine the water's primary movement direction. Thus, the moving average acts as a filter, highlighting the main direction and removing temporary fluctuations.
This method calculates the average value for a set number of consecutive data periods. As time progresses, older values are phased out of the calculation, and new ones are included, making the average 'move'.
For example, consider a company's stock prices over 10 days. If you compute a 5-day moving average, the first value will be the average of the first five days, the next value will be the average from the second to the sixth day, and so on.
In practice, this method makes it easier to see and interpret trends hidden behind daily fluctuations. The length of the period for which the average is calculated can vary significantly, depending on the analysis goals. Short periods are better for tracking short-term trends, while longer periods help identify long-term trends.
The moving average is a fundamental part of technical analysis in financial markets. Despite its simplicity, it remains one of the most popular and effective tools in a trader's arsenal. It helps in determining whether the market is trending upwards or downwards and can also form the basis for trading systems.
MA history
The Moving Average has roots that stretch back to ancient times and are not directly related to finance or economics. Let's explore how people used the moving average method for forecasting in the past.
Ancient traders and early applications of MA
Long before the modern stock exchanges appeared, ancient traders used analogs of the MA to monitor commodity prices and determine their average cost. Their objective was quite simple: to understand whether a commodity was becoming more expensive or cheaper compared to previous periods.
Birth of technical analysis
The real flourishing of the moving average began in the 20th century with the development of technical analysis. Charles Henry Dow, a co-founder of the renowned Dow Jones Index and author of Dow Theory, articulated the principles underlying the moving average. His ideas that markets move in trends and that studying past price dynamics can help predict the future laid the groundwork for many modern analysis tools, including the moving average.
Standardization and modernization
With the development of computer technologies in the middle of the 20th century, automating calculations became possible, significantly simplifying and accelerating the use of the moving average. As a result, the moving average gained popularity and was introduced into numerous trading platforms.
Scientific research and trading practices created new variants of this technical instrument, such as weighted, exponential, and others. Each variant was designed to improve prediction accuracy and minimize potential errors.
The moving average is a tool whose origins date back to ancient times. It evolved alongside markets and technologies, adapting to the new realities and demands of the time. Over centuries, it has been a reliable tool for traders, helping them make rational decisions based on price dynamic analysis.
Types of Moving Averages Method (MAs)
Several types of moving averages have been developed to enhance their accuracy and adaptability to different market conditions. Let's examine the key ones.
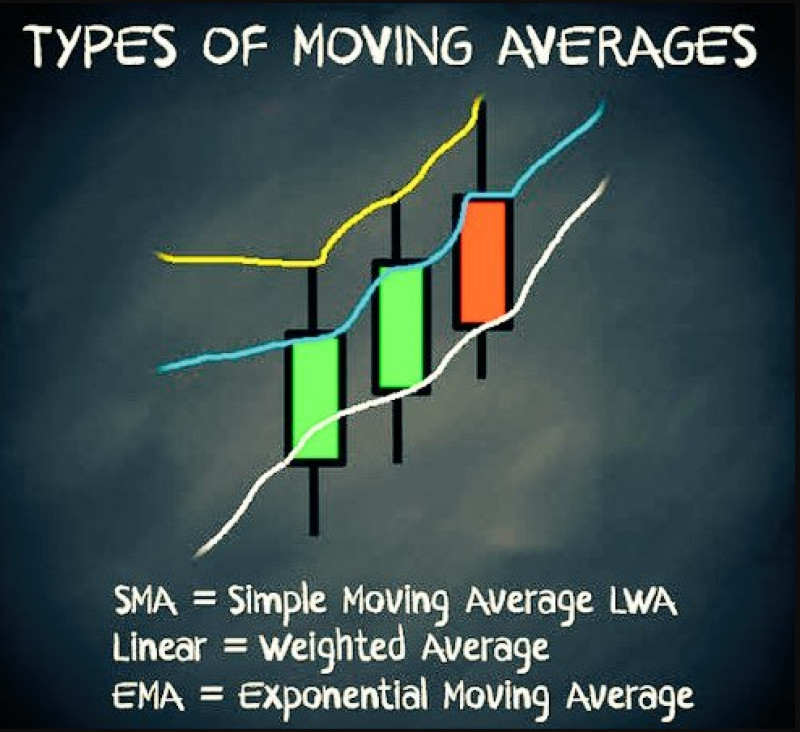
Simple Moving Average (SMA)
Description: The Simple Moving Average is the arithmetic mean over a fixed number of periods, where each value in the series has equal weight.
Example: A 5-day SMA is the average of prices over the last 5 days.
Application: The SMA is typically used to identify long-term trends. However, thanks to its simplicity, it can be slow to respond to rapid changes.
Exponential Moving Average (EMA)
Description: The EMA gives more weight to recent data, allowing it to respond quicker to changes. It considers all data in its calculation but with various weights.
Example: If a stock price drops sharply today, the EMA will reflect this change faster than the SMA.
Application: The EMA is often used to identify short-term trends and in the case of highly volatile markets.
Weighted Moving Average (WMA)
Description: Like the EMA, the WMA gives more weight to recent data. However, its calculation method differs, with the most significant weight given to the central value in the sequence.
Example: In a 5-day WMA, the last day will have a weight of 5, the previous day - 4, and so on, down to the first day with a weight of 1.
Application: The WMA is useful in markets where recent changes are crucial, but older data should not be overlooked.
Dynamic Moving Average (DMA)
Description: The DMA adapts to market volatility, automatically adjusting the interval length for calculating the average.
Application: Ideal for markets with changing volatility.
Traders can choose from different MA types, depending on market conditions and analysis objectives. Each type has its unique features and is used in various situations. However, they all share the common goal of helping to determine the primary direction of the trend.
How to calculate MA
The moving average is a very important tool in technical analysis. Understanding how to calculate it can provide insights into its functionality. Let's examine the calculation process for the main MA types.
1. Simple Moving Average (SMA)
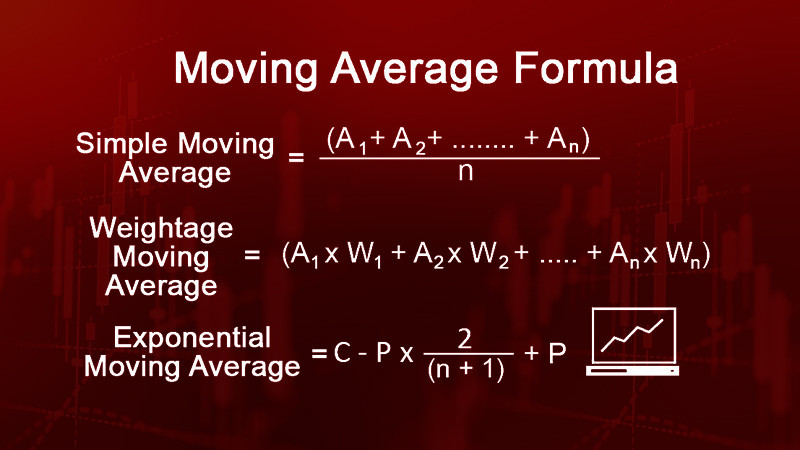
Formula: SMA = (P1 + P2 + ... + Pn) / n, where P1, P2, ... Pn are consecutive prices over n days.
Example: For prices over 5 days: 10, 11, 12, 13, 14. In this case, SMA = (10 + 11 + 12 + 13 + 14) / 5 = 60 / 5 = 12.
Application: As time moves forward, the next value is calculated by adding a new price, subtracting the old one from the total, and then dividing by 5.
2. Exponential Moving Average (EMA)
Formula: EMA = (Closing price – EMA (previous day)) × multiplier + EMA (previous day), where the multiplier = 2 / (n + 1) and n is the number of days.
Example: For a 5-day EMA, the multiplier would be 2/6 = 0.3333. If the previous EMA was 12 and today's closing price is 14, then EMA = (14-12) × 0.3333 + 12 = 12.6666.
Application: The EMA responds faster to price changes by giving more weight to recent data.
3. Weighted Moving Average (WMA)
Formula: WMA = (n × Pn + (n−1) × Pn-1 + ... + 1 × P1) / sum of weights
Example: For a 5-day WMA with prices of 10, 11, 12, 13, 14: WMA = (5 × 14 + 4 × 13 + 3 × 12 + 2 × 11 + 10) / 15 = 186 / 15 = 12.4.
Application: The WMA gives more weight to recent data, making it sensitive to recent price changes.
To calculate the moving average, an initial set of data is required. The more data you have, the more accurate your analysis will be. The main advantage of this method is that it filters out 'noise' from the data, highlighting the main trend.
Depending on your trading goals and time frames, you can choose different types and durations of moving averages.
MA application
This indicator is one of the most widely used tools in technical analysis. Let's explore the primary areas where the moving average can be implemented:
Trend identification:
The moving average (MA) is often used to indicate the main trend. Prices above this indicator may suggest an upward trend, while prices below it can indicate a downward trend.
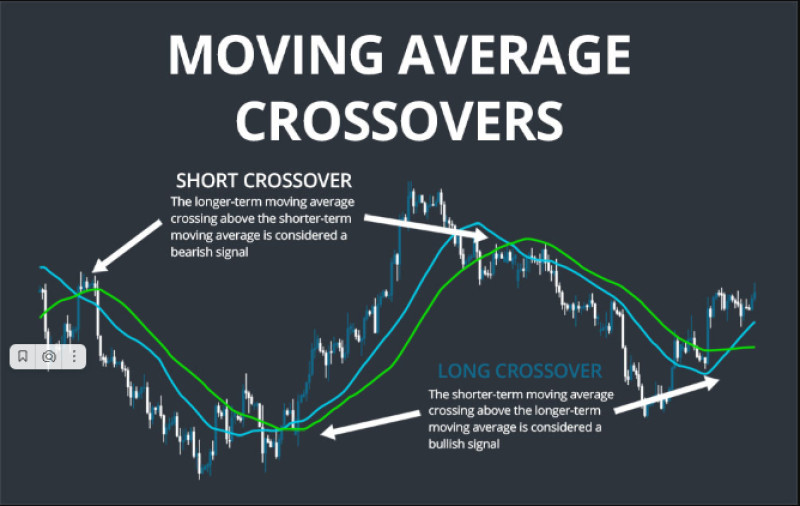
Buy and sell signals:
If a short moving average upwardly crosses a long one, we may consider this a buy signal. Conversely, if a short moving average downward crosses a long MA, this could be considered a sell signal.
Support and resistance:
Under certain market conditions, moving averages can act as support or resistance levels. If the price repeatedly bounces off a particular moving average, it could indicate a strong support or resistance level.
Noise reduction:
A key feature of this indicator is its ability to reduce noise or random price fluctuations, allowing traders to focus on more significant price movements.
Potential trend change indication:
When the price starts to deviate from its MA or when the line changes its trajectory, this can signal a potential trend reversal.
Divergence:
If the price reaches a new high but the moving average does not, this could indicate a weakening trend and a potential reversal.
Adaptability to market volatility:
The exponential and weighted moving averages allow traders to respond quickly to market volatility. In other words, MAs allow traders to make a decision in rapidly changing market conditions.
Moving averages could be used for numerous purposes, including basic trend identification and complex trading systems. They are versatile tools compatible with different strategies and market conditions. However, it is important to remember that, like any other tool, they should be applied in combination with other indicators and analysis methods.
Combination of several MAs
Combining multiple moving averages on a single chart is a popular practice among traders. Instead of relying on just one average line, traders use two or even three lines to generate additional signals and refine their analysis. Let's understand how this works and why traders should use it.
Why to combine MAs
The combination typically involves short-term and long-term moving averages. This approach provides a more detailed analysis of price movements, taking into account both current fluctuations and long-term trends.
How it works
One of the most common combinations includes a fast (short-term) and a slow (long-term) moving average. A buy signal appears when the fast moving average upwardly crosses the slow one, and conversely, a downward cross points to a sell signal. These crossing points are often referred to as the Golden Cross and the Death Cross.
Additional signals
A combination of three or more moving averages can create additional support and resistance levels. For instance, if an asset price is between the short-term and long-term moving averages, these lines can act as barriers.
What to take into account
When using a combined approach, it is important to be aware of potential false signals. In highly volatile markets or during sideways movements, moving averages might intersect each other frequently and unpredictably, making the signals less reliable.
A combination of multiple moving averages is an effective way to gain additional insights into price movements. It allows traders to refine their signals and creates extra support and resistance levels. However, it is important to keep in mind potential risks and false signals and to use this method together with other analysis tools.
MA accuracy
Moving averages are a popular and frequently used indicator in technical analysis. However, their accuracy and reliability for making trading decisions vary.

Lagging principle:
It is important to recognize that moving averages are lagging indicators. They react to price movements rather than predicting them. Consequently, they may not immediately reflect changes in trends or their potential exhaustion.
Smoothing and noise:
While moving averages effectively smooth out market noise, they can also delay the response to actual changes, especially over longer time intervals. This delay can lead to missed opportunities for entering or exiting trades.
Period selection:
The accuracy of a moving average largely depends on the chosen period. Short periods are more sensitive to price changes, but they can generate more false signals. Longer periods might miss early entries or exits, but they are usually more reliable in the long term.
Combined approach:
Many traders use a combination of multiple MAs (e.g., short and long) to enhance accuracy. When a short moving average method upwardly crosses a long one, traders may consider this a positive signal, and vice versa.
Additional indicators:
To increase accuracy, it is recommended to use moving averages together with other indicators such as volume, momentum, or relative strength indicators.
Market situation:
The accuracy of moving averages also depends on the overall market condition. They can be particularly useful in strong trending conditions but may produce many false signals if the market trades sideways.
Exceptions and unexpected situations:
Any indicator, including moving averages, can encounter situations where the market behaves in an unusual way or unpredictably. In such cases, the indicator might provide inaccurate signals.
In conclusion, moving averages are a very useful tool, but their effectiveness and accuracy depend significantly on their proper application and combination with other analysis methods.
Advantages and disadvantages of MAs
As one of the most popular technical analysis indicators, the moving average has its advantages and disadvantages. Let's consider them.

Advantages:
Simplicity and clarity: For beginners, moving averages are an excellent starting point as they are easy to understand and interpret. They provide a visual indicator that could be easily noticed on a chart.
Data smoothing: Moving averages eliminate market noise by highlighting the primary price movement, making the chart more readable.
Flexibility: The ability to choose different periods for the indicator allows traders to customize it to their needs, adapting to various market conditions.
Multiple applications: This tool can be used in various aspects of technical analysis, from identifying trends to detecting support and resistance levels.
Combined analysis: Moving averages are often paired with other indicators to create more complex and reliable trading systems.
Disadvantages:
Lagging: Being based on past data, moving averages sometimes lag behind current market movements, leading to delayed entries and exits.
False signals: In the case of a sideways trend, moving averages could generate numerous false signals, potentially leading to unprofitable trades.
Limitations: Moving averages perform best in markets with a clear trend. In highly volatile markets without a clear trend, their effectiveness is lower.
Over-optimization: There are many different periods for moving averages, and traders can fall into the trap of constantly searching for the perfect period.
Psychological dependence:
Some traders may become overly reliant on moving averages, ignoring other important aspects of market analysis.
The moving average indicator is an excellent tool for technical analysis, but like any other tool, it is not perfect. Successful use requires combining it with other analysis methods, understanding its limitations, and life-long learning.
Conclusion
The moving average Method (MA) is not only a cornerstone of technical analysis but also one of the most popular tools among traders of varying levels of experience. Is this appreciation justifiable?
The fact is that its simplicity and visual representation make it an indispensable tool, particularly for novice traders. The smoothing of price fluctuations allows traders to see a trend clearly and not react to minor market noise.
The moving average method does more than just identify trends. It also detects potential reversal points, identifies support and resistance levels, and signals when it is necessary to act. However, like any tool, the moving average has its downsides. It can lag behind real data, generate false signals in sideways trends, and require choosing an optimal time period. All these factors require great attention and a critical approach. There is no use in relying solely on this indicator, ignoring other analysis methods.
What is more, to successfully use the moving average, it is better to combine it with other technical and possibly fundamental analysis tools. Understanding the current market condition, volatility, and other factors can help correctly interpret data from the moving average.
In practical application, each trader should choose an appropriate tool based on their strategy, skills, and trading style. The moving average is an excellent starting point, but as experience accumulates, many traders combine it with other methods or complement it with new indicators.
To sum up, versatility is the main value of the moving average. It can be adapted to different market conditions, assets, and time frames, making it one of the most effective tools.
The moving average deserves the attention of anyone serious about trading in financial markets. However, as always, the key to successful trading lies in the combination of knowledge, experience, and proper risk management.
You may also like:


