


Every trader navigates through the complexities of the market in a way that best suits their strategy, identifying the most opportune moments to enter the market. Some are drawn to strategies that involve layering technical indicators onto charts, while others believe that this only muddies the waters, preventing a clear view of the unfolding market dynamics.
Trading opportunities in the Forex market can be unearthed in any period. However, it's pivotal to discern which methodologies are best employed during times of directional movement and which are preferable during a flat market.
In this article, we will delve deeper into the intricacies of one of the most popular and straightforward tactics, the Puria Method. To explore further about other strategies, their application nuances, and to weigh their pros and cons, refer to the article "Trading Methods"
Understanding strategies and how to create one
Engaging in successful trading without employing a trading strategy is an unattainable feat. While one might execute a few successful trades, it would be more a matter of chance than a consistent outcome. For long-term results, a clear trading plan is indispensable.
A trading algorithm encompasses a set of clear rules, addressing the most pivotal aspects of trading:
- Methods and approaches for market analysis
- Conditions for opening and closing positions
- Risk management
- Money management
- Maintaining trade statistics
- Discipline and psychological factors.

A trading strategy must take into account the individual characteristics of the trader, including their personality, habits, availability of free time for trading, and other factors.
For those embarking on their trading journey, developing a personal trading algorithm might pose a challenge. Therefore, in the initial stages, it's advisable to utilize ready-made strategies available on the Internet.
Adherence to all the rules of the strategy is paramount. This means trading precisely with the instruments and within the time frames embedded in the algorithm. Altering the fundamental settings of the strategy for other assets or time frames should only be undertaken by experienced users.
Experimenting with combining elements from various strategies and uniting them into one is also a viable approach. However, it's essential to understand how each element interacts with the others and how they need to be configured to ensure their combination yields the desired result.
It is precisely by utilizing pre-established strategies that a trader can comprehend and define their own trading style. By attempting to apply short-, medium-, and long-term algorithms, one can select the option that is most suitable for their specific needs.
Moreover, it's crucial to determine the most fitting method of market analysis, or their combination, and to choose assets for trading. While some traders exclusively use indicators for analysis, others believe they merely clutter the chart.
Exploring various trading strategies
The world of trading algorithms is vast and varied. To navigate through this multitude without getting entangled, it's possible to categorize them into different types. Various criteria can be chosen for this classification. Let’s explore some of them:
1. Based on position holding time:
• Short-term strategies typically involve a large number of trades lasting from a few seconds (scalping) to one day (day trading);
• Medium-term trades last from several days to several weeks;
• Long-term trades can be held open up to a year.
2. Based on Analysis Method:
• Indicator-based – indicators are used to derive signals for opening positions;
• Non-indicator – only the chart and the patterns formed on it are used to predict future price movements.
3. Based on type of analysis:
• Technical involves studying the chart itself and seeking price movement patterns within it;
• Fundamental is based on the impact of macroeconomic factors, the release of crucial economic and financial news, corporate reports, and so forth on the price.
4. Based on deal opening method:
• Trend-following – deals are opened in the direction of the prevailing market trend;
• Counter-trend – deals are opened against the current trend during pullbacks.
5. Based on entry type:
• Breakout – applied when the price breaks through one of the range boundaries and makes a strong move;
• Pullback – used when the price moves zigzag within a certain range.
6. Based on Technical Parameters:
• Manual – analysis and trading are conducted by the trader independently, or analysis is performed by a bot, with the trader making the final decision on deal execution;
• Automatic – trading is fully conducted by specialized programs (trading robots).
Indicator strategies
This type of strategy is considered one of the most popular among users, primarily because it doesn’t demand a wealth of knowledge and experience, making it suitable even for beginners.
The core essence of these algorithms involves utilizing a certain combination of indicators to derive signals for initiating a trade. Let’s delve deeper into how these strategies operate.
So, why is it necessary to apply several indicators instead of just one? The fact is that each indicator inherently has its own pros and cons and, typically, cannot objectively assess the market situation on its own.
Some indicators tend to lag, while others might lead. Therefore, their judicious combination allows for the confirmation and filtering of each other's signals.
At the same time, it is not recommended to use too many indicators simultaneously as their readings might confound the trader and complicate the trading process rather than simplify it.
Additionally, other factors, such as the trading instrument for which the strategy is intended, the time frame, and others, must be taken into account. Some strategies are designed for trading specific currency pairs, while others are universal.
Also, the description and settings of a trading strategy often specify one or several timeframes. This is often related to the type of a strategy: shorter time frames are used for short-term strategies, while longer ones are used for medium- and long-term strategies.
Moreover, any algorithm can be adapted to current conditions or the individual requirements of the user. Furthermore, every strategy requires periodic adjustments and modifications, considering the evolving market conditions.
Types of indicators
Technical indicators used for market analysis vary by functions they perform. Depending on their specifics, indicators fall into following categories:
1. Trend indicators
2.Oscillators
3. Volume indicators
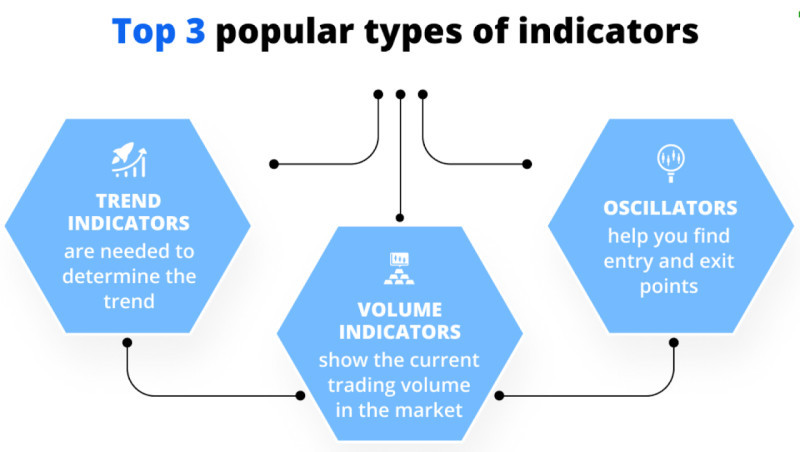
Trend indicators enable traders to identify the direction of the prevailing trend – whether it is ascending or descending. Additionally, they are also utilized to determine the strength of the current trend, meaning its stability and the potential for a swift shift to the opposite trend.
Often, the calculation basis of indicators in this category involves data averaging, which allows for the exclusion of market noise. Some of the most renowned representatives of this category include moving averages, Bollinger Bands, and others.
Conversely, the second group of indicators performs well during periods when the price moves within a certain range, bounded by upper and lower support and resistance lines.
Typically, indicators of this group are not plotted on the price chart but are constructed in a separate window. They can provide various types of signals such as market overbought or oversold conditions, and divergence between the indicator readings and the chart.
The most popular indicators of this category are the Stochastic Oscillator, RSI (Relative Strength Index), and MACD (Moving Average Convergence Divergence).
Volume indicators are considered by some users to be a subgroup of oscillators, while others categorize them into a separate group. In any case, representatives of this group are used to identify the activity of trading participants and their interest in a particular asset.
Readings from these indicators are used in conjunction with other tools to confirm the veracity of their signals.
Trend strategies
Many strategies are based on the principle of market cyclicity. All events and price fluctuations tend to repeat over time. Therefore, both modern strategies and those developed several decades ago possess equivalent efficacy.
Among strategies based on technical analysis, trend algorithms hold a special place. They are fundamentally grounded in trend indicators, the tools that help traders determine the direction and strength of the current trend.
The essence of trend strategies lies in accurately identifying the current trend direction, selecting the right moment to enter the market, and pinpointing the correct position exit point.
Among the most frequently used indicators in trend strategies, moving averages stand out. These indicators overlay the chart in the form of lines, mirroring its bends.
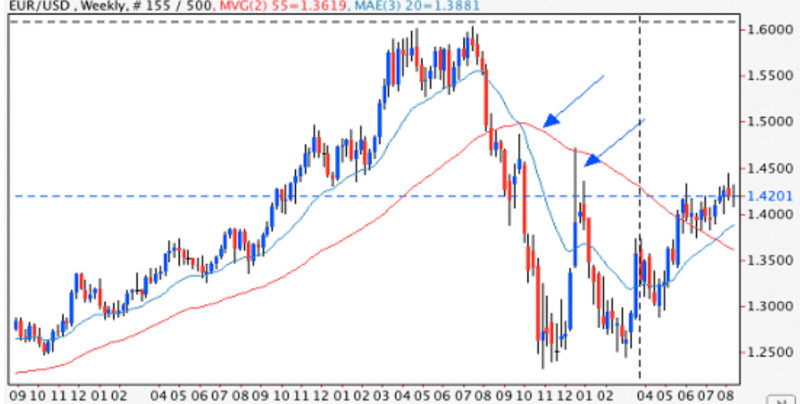
One of the first trend strategies emerged based on the crossing of moving averages. There's a belief that the developers of this strategy were able to earn millions from it.
While this might just be a legend, one thing is certain – this methodology remains relevant even today. Therefore, it is utilized in many trend trading algorithms.
The only significant drawback of such strategies is the large number of potentially false signals. This is due to the fact that this group of indicators performs well only in segments with a pronounced directional price movement.
To mitigate this drawback, it is necessary to incorporate filters into the strategy, which will distinguish between true and false signals. Often, indicators from other groups, such as oscillators, are used as such filters.
Puria Method
Having dissected various categories of trading strategies, we can proceed to explore some specific ones among them. In this article, we will pay closer attention to the Puria Method, which falls under indicator trend algorithms.
This strategy is utilized for intraday trading, meaning trades are opened and closed within a single trading day, without overnight carry. Exceptions are made in situations where a powerful trend movement is observed, which can bring substantial profit.
When keeping trades open within one day, profit from each can reach 40-50 points, while holding positions for several days under favorable conditions can yield several hundred points.
This algorithm employs only a specific set of indicators, without any additional tools. It is designed for trading any currency pairs, however, there are recommendations for choosing the timeframe and setting the Take Profit level for each pair.
Usually, trading is conducted on time intervals not less than 15 minutes, from M15 to H1. Setting the Take Profit level, depending on the chosen pair, can vary from 15 to 25 points.
The strategy is based on classic trend indicators where three moving averages with different periods. In addition to them, the MACD oscillator is used, which helps to filter and confirm their signals.
Meanwhile, different sources indicate various types of moving averages. Some believe that two simple moving averages and one exponential should be used, while others utilize all three exponential moving averages.
Setting up indicators
As previously mentioned, no unusual indicators are required for this strategy. The Puria Method involves several classic indicators, which are included in the basic set of any trading platform.
However, each element has its own settings that need to be established in advance. In this way, you can be confident that the methodology will work correctly and yield the desired result.
So, to start, three moving averages need to be plotted on the chart. The first two movings should be simple and set for periods of 75 and 85, while the third moving should be exponential with a period of 5.
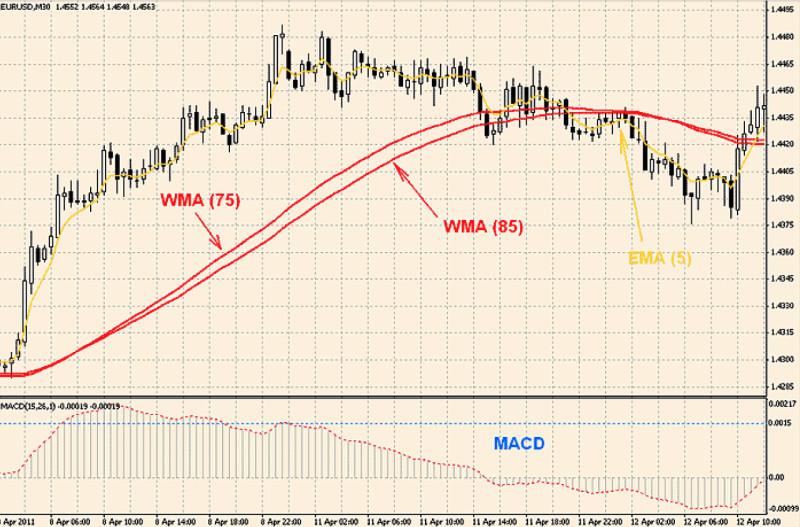
The application of three moving averages to the chart and their interaction with each other resembles the 'Alligator' indicator, where the three movings intertwine during periods of sideways price movement and demonstrate similar directional movement during trend periods.
The exponential line reacts to price changes more quickly, and its signals can be used as the first confirmation for entering a trade. Simple movings may provide delayed signals, hence the need for an oscillator.
For the MACD indicator, the following parameters need to be set: 15, 26, and 1. The chart of this indicator indicates which forces are prevailing in the market at the current moment. If the histogram is above the zero mark, the 'bulls' dominate, and if it is below, then the 'bears'.
In addition, it is necessary to check the trade history for several months. In case the MACD is not working quite correctly, you can change the basic settings for the ascending trend to 8, 17, 5, while leaving the settings for the descending trend unchanged.
Making trades
How exactly do we receive signals and open positions using the strategy under consideration? The Puria Method provides quite specific and clear signals, without any ambiguity, making it relatively simple to trade using it.
Let's look in more detail at what conditions must be met to open long and short positions. In addition, it is important to understand where and how to set protective levels - Take Profit and Stop Loss.
Trades to purchase assets are opened when the 'slow' MA (with periods of 75 and 85) are breached by the 'fast' one (with a period of 5) in an upward direction. The second condition is the closing of at least one bar of the MACD chart above the zero mark.
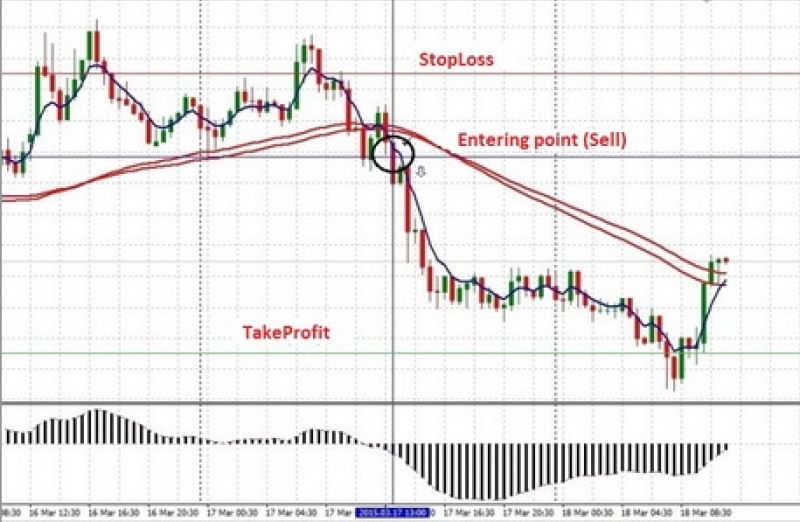
To open sell positions, the opposite conditions should be sought: the 'fast' moving average should cross the 'slow' ones from top to bottom. In addition, the oscillator histogram should be below the level 0.
The 'slow' movings act as a filter for the presence of a trend on the price chart, as they reflect the price movement on higher timeframes. If the 'fast' MA crosses only one of the 'slow' ones, or the chart itself rises above or falls below these lines, the signal is considered false.
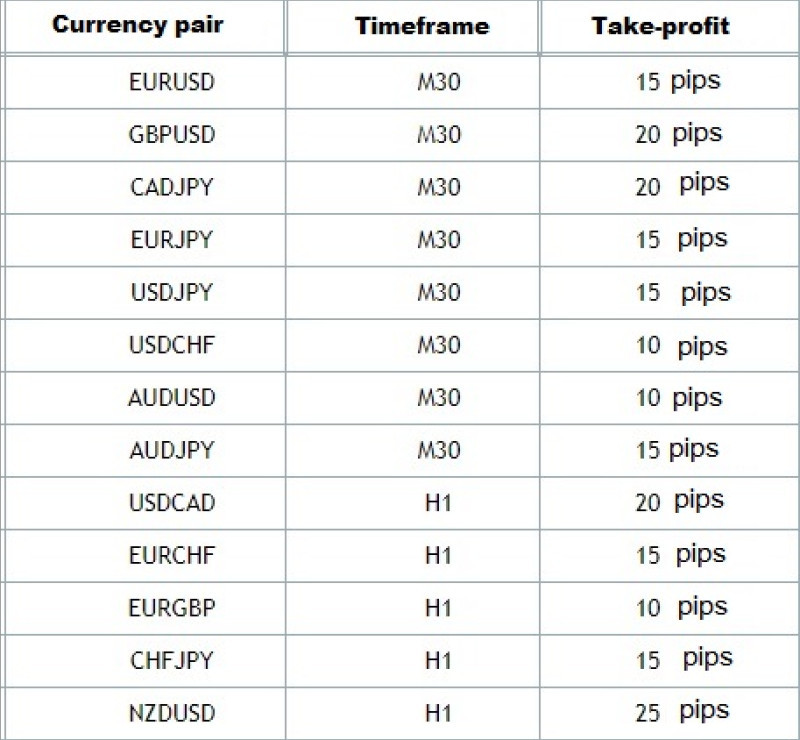
To set a profit target, the authors of the methodology have developed a table with specific Take Profit values for each currency pair. For example, for EURUSD - 15 pips, GBPUSD - 20 pips, AUDUSD - 10 pips.
As for setting Stop Loss, there are two main positions: you can either not set it at all, as it is supposed to close positions quickly when the trend changes, or you can still set it.
For beginner traders it is recommended to use the second option and determine the level of Stop Loss at the mark of not less than 10-15 points. You can also mark this level behind the last local extremum on the chart: the minimum for long trades and the maximum for short trades.
Puria template for MT5
Although the methodology under consideration allows trading with various currency pairs, the indicator settings remain the same for all of them. Only the timeframes and profit targets differ for each individual pair.
It is unlikely to consistently earn on the same pair every day, so it is necessary to periodically change pairs. However, applying indicators to the chart and setting values for them each time is not very convenient.
For this reason, the MT5 trading terminal provides the ability to save templates, which include the necessary combinations of indicators and their settings.
Thus, the user sets the desired settings for the indicators on one chart, and then saves them as a template. When applying the template to the charts of other trading instruments, their appearance will fully correspond to the first one, on the basis of which the template was created.
In addition to the settings of the indicators themselves, other parameters can also be fixed in the templates: color solutions, attached advisors, graphical objects, and other elements. Also, the created templates can be modified or deleted if necessary.
Using templates helps save the trader's energy and time, as they do not need to reapply and configure the necessary indicators on the chart each time. This is particularly relevant in cases where more than two indicators are used in strategies simultaneously.
Automation
Developing one's own trading strategy or a specific trading methodology is a significant and necessary step for every trader. Adhering to the rules of their strategy can yield stable results and profit over an extended period.
However, over time, performing routine operations according to the same algorithm can become tedious for the user. They may want to move forward, develop new strategies, and try new methods.
How can one combine profiting from an already developed successful strategy and developing new algorithms? For this, special computer programs are created - trading robots or advisors.
There is one serious distinction between them. Advisors are semi-automatic programs that fully analyze the market and signal the trader to open a position. However, the decision to open a trade is made by the user themselves.
Robots are fully automatic programs that not only perform all the routine work of daily market analysis but also independently open and close positions without human intervention.
By the way, it was precisely the creation of an advisor based on the Puria method that made it widely known to traders around the world. In 2010, this advisor took second place in a prestigious international competition.
The simpler the initial trading algorithm, the easier it is to automate and create an advisor based on it. This was the case with the methodology under consideration: moving averages are classic indicators used by traders for decades.
All principles and conditions for opening trades are embedded in the program. When one position is already open, the advisor ignores the appearance of new signals. But as soon as the deal is closed, the program immediately begins searching for new entry points.
For novice users, the idea of using trading bots may seem extremely attractive. However, any experienced trader will say that leaving an advisor unattended is not advisable.
It is necessary to periodically monitor its work and control the market situation. If there are any sudden and unforeseen changes in the market, the advisor will continue to trade in the usual manner and will start bringing losses instead of profit.
Conclusion
In this article, we have explored various types of trading strategies, as well as delved into all the nuances of using a popular trading algorithm - the Puria Method.
This methodology belongs to trend indicator strategies. It is based on classic indicators - moving averages with specific periods and the MACD oscillator.
This methodology uses a simple and harmonious combination of tools that complement each other. Moving averages tend to lag, and the oscillator is designed to filter their signals.
It is important to understand that a signal is only true when the 'fast' moving average crosses two 'slow' ones. In all other cases, the signal is considered false.
This methodology gained widespread recognition thanks to the advisor created based on it. Bots are still very popular as they significantly facilitate traders' work. However, they need to be used carefully and under user control.
You may also like:


