Thursday Trade Analysis
EUR/USD 1H Chart
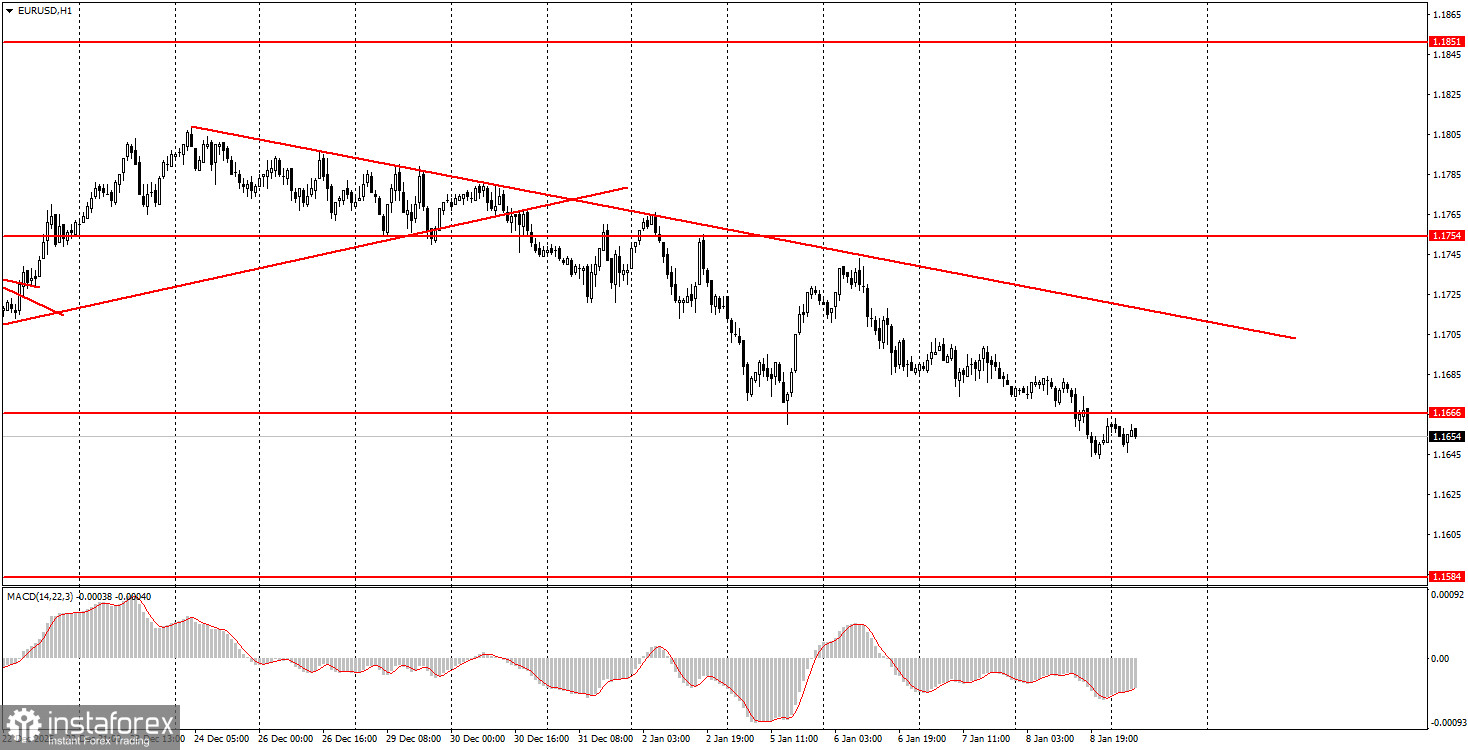
The EUR/USD currency pair continues a very weak decline within a new downward trend. From the perspective of fundamental and macroeconomic analysis, we cannot say that the growth of the U.S. currency is justified. This week, several important reports were published in the United States, and most of them turned out to be disappointing. Geopolitical events around Venezuela are also difficult to count as positive factors for the dollar. However, even if we are mistaken, the market movement is too weak to be considered a reaction to specific events.
We believe the explanation is much simpler. A flat market persists on the daily timeframe. For six consecutive months, the price has been trading between 1.1400 and 1.1830. Several weeks ago, the euro once again failed to consolidate above the sideways channel, a reversal occurred near its upper boundary, and therefore we are now observing a purely technical move toward the lower boundary. That is the entire explanation. On Thursday, there was no important macroeconomic background, but today the most important U.S. labor market and unemployment reports will be released.
EUR/USD 5M Chart
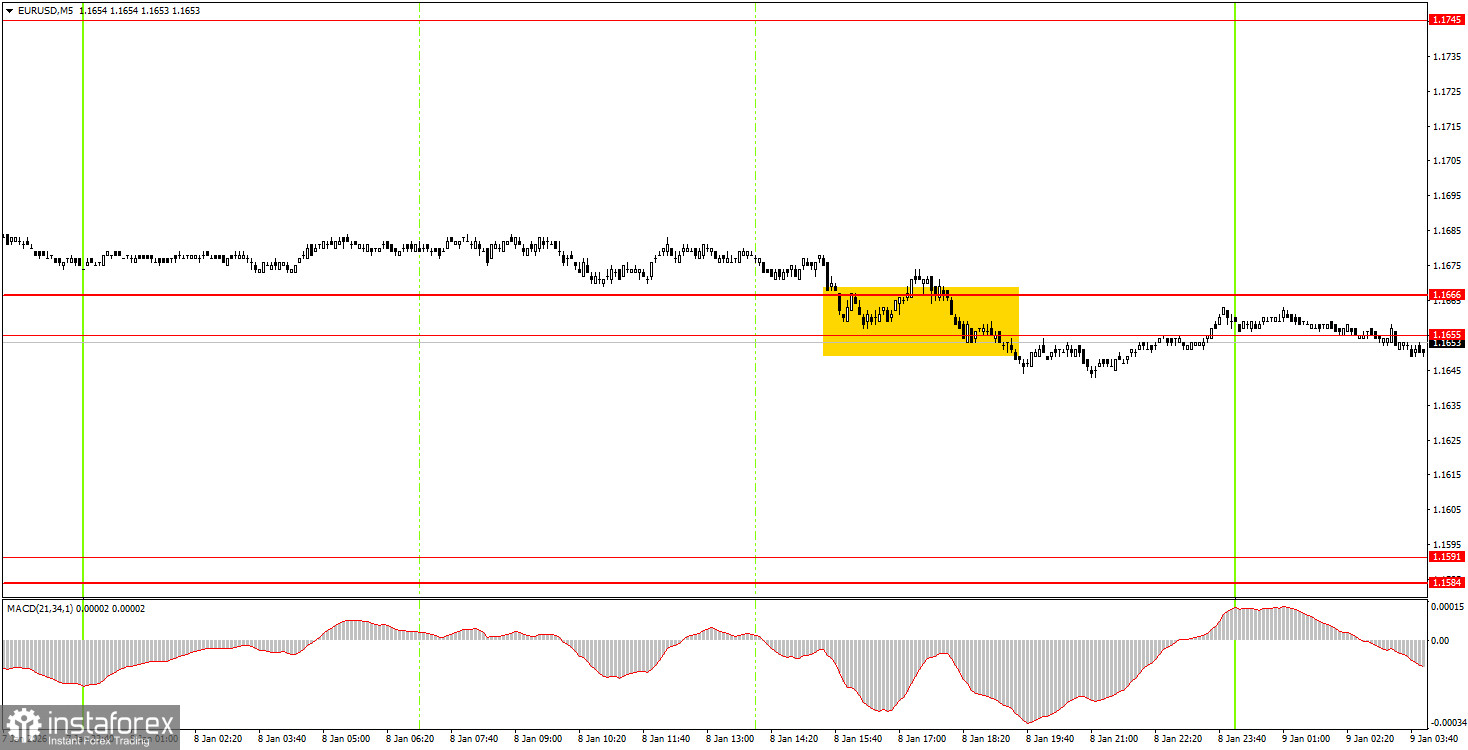
On the 5-minute timeframe, one sell signal was formed on Thursday, but total daily volatility amounted to only 41 points. Overall, further analysis is hardly necessary, as market movements were once again absent. A consolidation below the 1.1655–1.1666 level allowed—and still allows—beginner traders to open short positions, but at this pace the pair would take a week to reach the target level of 1.1584–1.1591.
How to Trade on Friday
On the hourly timeframe, a downward trend continues to form, as indicated by the trend line. The pair failed to break the 1.1800–1.1830 level, which is the upper boundary of the flat range on the daily timeframe, so technically the decline is justified and may continue all the way to 1.1400. The overall fundamental and macroeconomic background remains very weak for the U.S. dollar; therefore, we expect the pair to resume growth in the medium term. However, the flat market on the daily timeframe plays a dominant role.
On Friday, beginner traders can trade from the 1.1655–1.1666 level. A rebound from this area will allow opening short positions with a target of 1.1584–1.1591. A consolidation above this area will make long positions relevant with a target of 1.1745.
On the 5-minute timeframe, the following levels should be considered: 1.1354–1.1363, 1.1413, 1.1455–1.1474, 1.1527–1.1531, 1.1550, 1.1584–1.1591, 1.1655–1.1666, 1.1745–1.1754, 1.1808, 1.1851, 1.1908, 1.1970–1.1988.
Today, a retail sales report will be released in the European Union, but what is the probability of a strong market reaction to this report? In the United States, data on Non-Farm Payrolls, unemployment, wages, and consumer sentiment will be published. And we are not sure that even this data will force the market to move even slightly more actively.
Basic Trading System Rules
- Signal strength is measured by the time required to form the signal (a rebound from or a break of a level). The less time required, the stronger the signal.
- If two or more trades were opened near a certain level based on false signals, all subsequent signals from that level should be ignored.
- In a flat market, any pair may form many false signals or none at all. In any case, at the first signs of a flat market, it is better to stop trading.
- Trades should be opened during the time period from the start of the European session until the middle of the U.S. session, after which all trades should be closed manually.
- On the hourly timeframe, it is advisable to trade MACD indicator signals only when there is good volatility and a trend confirmed by a trend line or trend channel.
- If two levels are located too close to each other (from 5 to 20 points), they should be considered as a support or resistance zone.
- After the price moves 15 points in the correct direction, the Stop Loss should be moved to breakeven.
What Is Shown on the Charts
- Support and resistance price levels – levels that serve as targets when opening buy or sell trades. Take Profit levels can be placed near them.
- Red lines – trend lines or channels that show the current trend and indicate the preferred trading direction.
- MACD indicator (14, 22, 3) – the histogram and signal line serve as auxiliary indicators and can also be used as signal sources.
Important speeches and reports (always listed in the economic calendar) can have a very strong impact on the movement of a currency pair. Therefore, during their release, trading should be conducted with maximum caution or positions should be closed to avoid sharp price reversals against the prior move.
Beginner forex traders should remember that not every trade can be profitable. Developing a clear strategy and proper money management are the keys to long-term success in trading.