EUR/USD 5M Analysis
The EUR/USD currency pair continues to slide sluggishly downward. At the moment, traders may have the impression that the market is responding positively to Trump's actions related to Venezuela, his statements regarding Greenland, and his threats to conduct military operations in Latin American countries. Traders may also have paid attention this week to the macroeconomic background from the United States, which for the most part turned out to be weak. And what do we have as a result? Trump's protectionist policy has shifted toward more authoritarian measures, while U.S. economic data continue to be weak despite record GDP growth in the third quarter. What does all this say? That macroeconomics and fundamentals have absolutely nothing to do with the rise of the dollar.
Let us recall that several weeks ago the price reached the 1.1800–1.1830 level, which is the upper boundary of a sideways channel on the daily timeframe that has lasted for six months. Failing to break through the upper boundary of the channel, the price reversed and began moving toward the lower one. This is the most logical explanation for what is happening.
There is another piece of evidence supporting our hypothesis—volatility. If the market were reacting to U.S. economic data and events related to Trump, volatility would probably be higher than it is now.
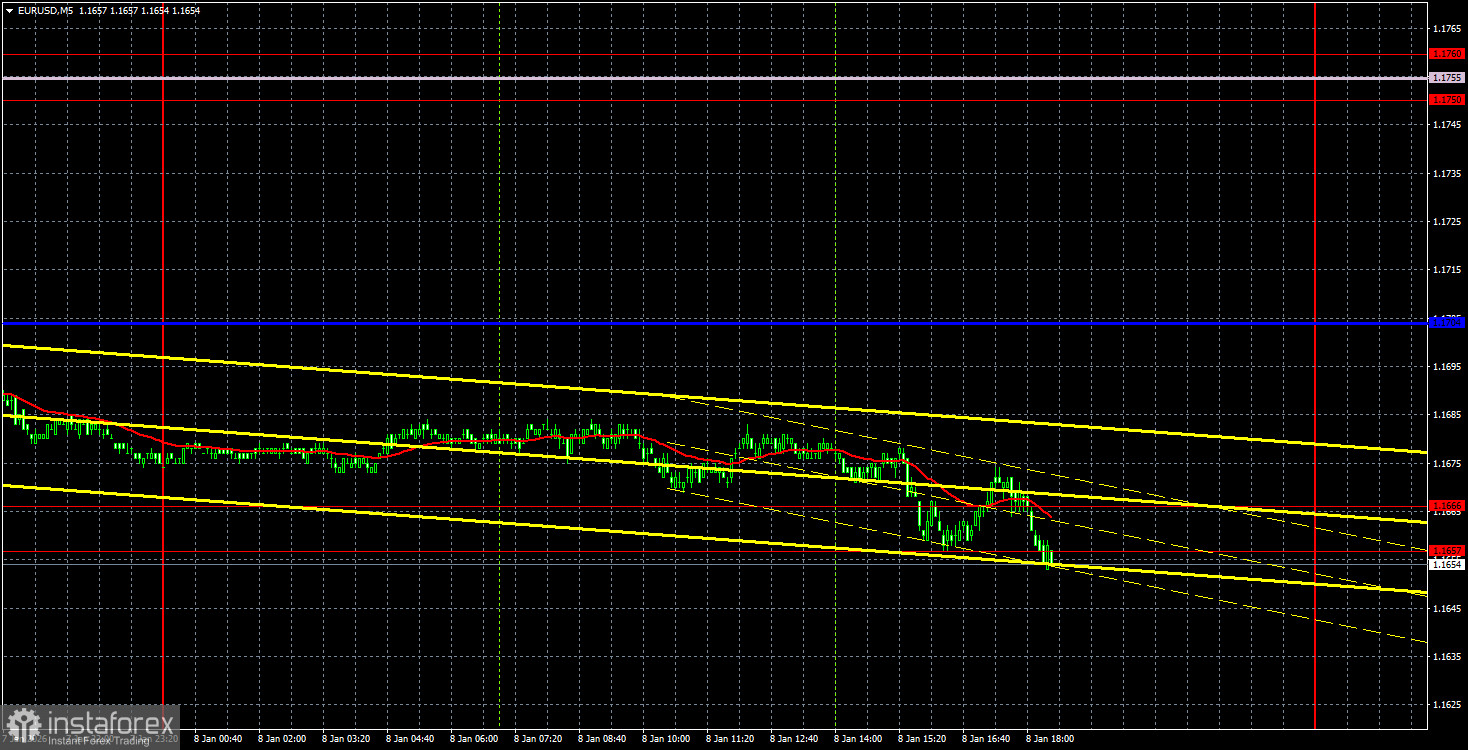
On the 5-minute timeframe, the last trading signal was formed back on Wednesday, when the price rebounded from the critical line. Over two full trading days, the pair barely managed to cover a distance of 30 points and worked off the 1.1657–1.1666 level. Therefore, those who opened short positions on Wednesday could make a profit on them on Thursday.
COT Report
The latest COT report is dated December 23. The illustration above clearly shows that the net position of non-commercial traders had been "bullish" for a long time. Bears managed to move into a position of dominance with difficulty at the end of 2024, but lost it very quickly. Since Trump took office as U.S. president for the second time, only the dollar has been falling. We cannot say with 100% probability that the decline of the U.S. currency will continue, but current global developments hint precisely at this scenario. The red and blue lines are moving away from each other, which indicates a very strong dominance of the bulls.
We still do not see any fundamental factors for strengthening the European currency, but there remains a sufficient number of factors for the decline of the American one. The global downward trend still persists, but what does it matter now where the price has moved over the past 17 years? Over the past three years, the European currency has shown consistent growth, which can be considered a trend.
The positioning of the red and blue lines of the indicator continues to point to the persistence and strengthening of the bullish trend. During the latest reporting week, the number of long positions held by the "Non-commercial" group increased by 16.2 thousand, while the number of short positions increased by 1.2 thousand. Accordingly, the net position increased by another 15.0 thousand over the week.
EUR/USD 1H Analysis
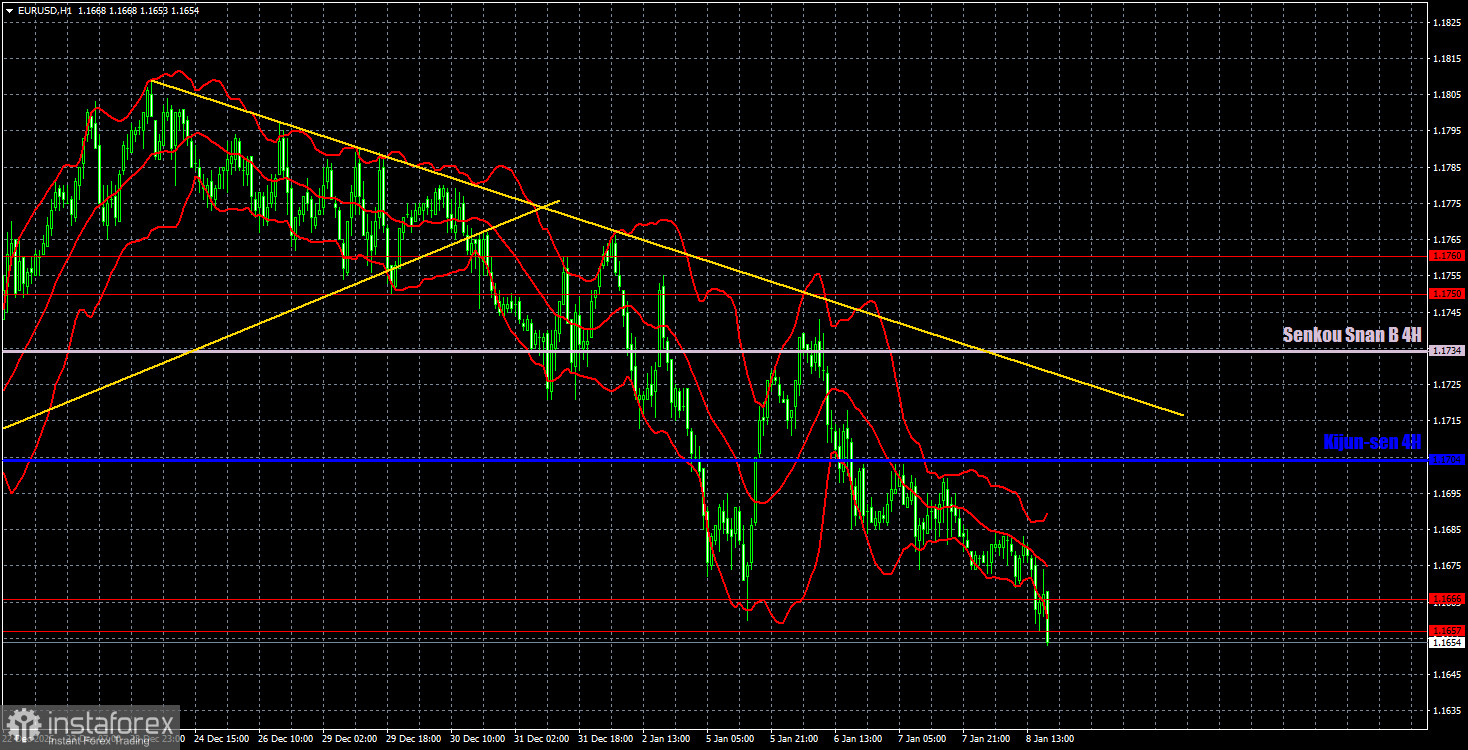
On the hourly timeframe, the EUR/USD pair continues to form a downward trend. In fact, the upper boundary of the 1.1400–1.1830 sideways channel was tested twice, and the euro failed to exit this channel. This week, the market is processing a large amount of important information, but so far it has largely ignored most reports. Of course, we support a new rise in the European currency, and COT reports continue to signal an increase in long euro positions by market makers. However, the euro now needs to break through the trend line.
For January 9, we highlight the following trading levels: 1.1234, 1.1274, 1.1362, 1.1426, 1.1542, 1.1604–1.1615, 1.1657–1.1666, 1.1750–1.1760, 1.1846–1.1857, 1.1922, 1.1971–1.1988, as well as the Senkou Span B line (1.1734) and the Kijun-sen line (1.1704). Ichimoku indicator lines may move during the day, which should be taken into account when determining trading signals. Do not forget to move the Stop Loss order to breakeven if the price moves 15 points in the correct direction. This will protect against potential losses if the signal turns out to be false.
On Friday, the European Union is scheduled to publish a retail sales report, while the U.S. will release Non-Farm Payrolls, the unemployment rate, average earnings, and the University of Michigan Consumer Sentiment Index. If one is to expect at least relatively strong movements, it would be at the beginning of the American trading session.
Trading Recommendations
On Friday, traders can trade from the 1.1657–1.1666 level. A consolidation below the 1.1657–1.1666 level will allow opening new short positions with a target of 1.1604–1.1615. A rebound from the 1.1657–1.1666 level will make long positions relevant, with targets at the Kijun-sen line and the Senkou Span B line.
Explanations to the Illustrations
- Support and resistance price levels – thick red lines near which price movement may end. They are not sources of trading signals.
- Kijun-sen and Senkou Span B lines – Ichimoku indicator lines transferred to the hourly timeframe from the 4-hour timeframe. These are strong levels.
- Extreme levels – thin red lines from which the price previously rebounded. They are sources of trading signals.
- Yellow lines – trend lines, trend channels, and any other technical patterns.
- Indicator 1 on COT charts – the size of the net position of each category of traders.