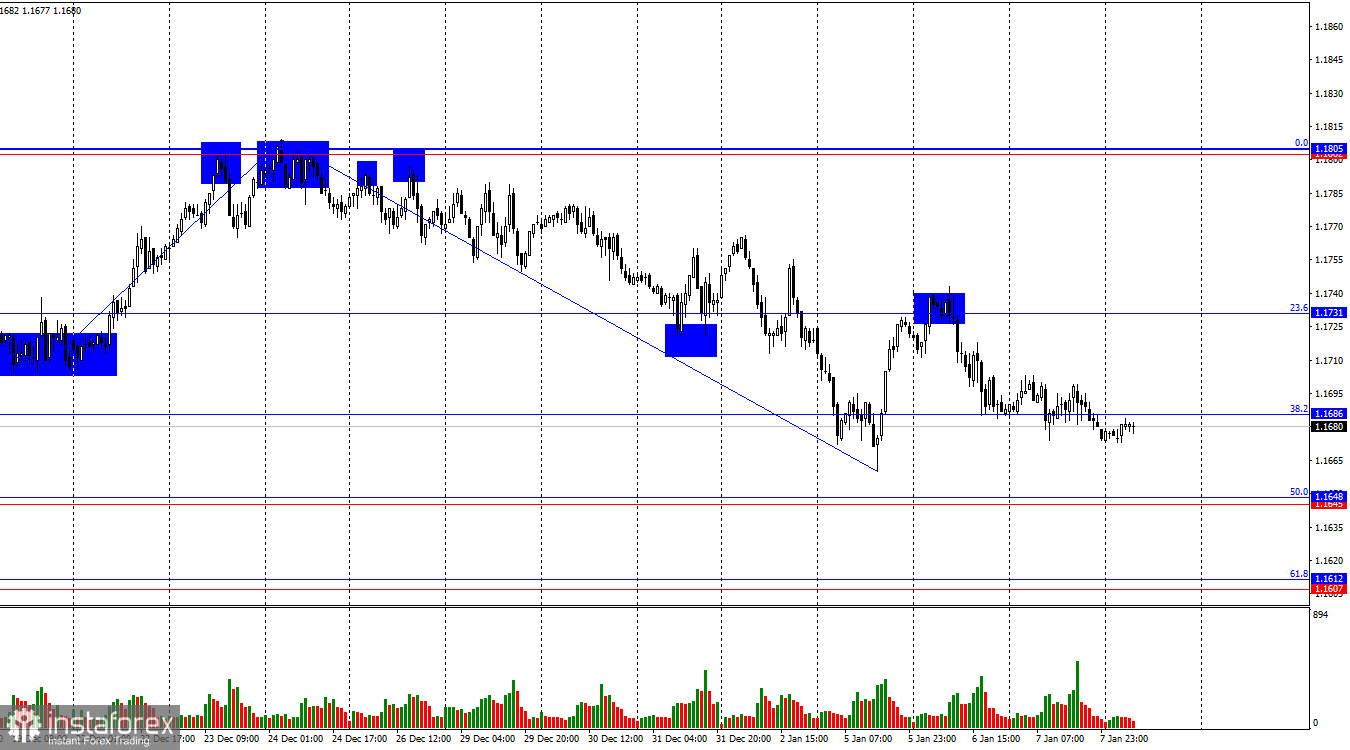
The EUR/USD pair continued its decline on Wednesday, a process that has been going on for two weeks now, but trader activity remained minimal. Below, we will take a closer look at this situation. A consolidation below the 38.2% Fibonacci level at 1.1686 allows for expectations of a continued decline toward the support level at 1.1645–1.1648. A close above 1.1686 today would allow traders to anticipate a modest rebound toward the 23.6% corrective level at 1.1731.
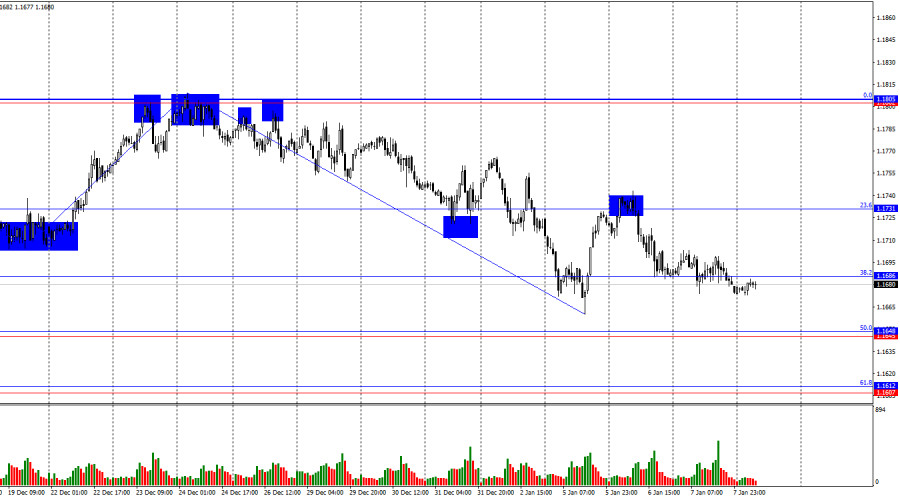
The wave structure on the hourly chart remains straightforward. The most recently completed upward wave failed to exceed the peak of the previous wave, while the new downward wave broke the previous low. Thus, the trend has shifted to bearish. In my view, the decline is unlikely to be prolonged, but a break of the bearish trend is now required before expecting a renewed rise in the euro. Based on the current chart structure, such a break would occur above the resistance zone at 1.1795–1.1802 or after two consecutive bullish waves.
On Wednesday, traders had plenty of information triggers for active market participation. However, surprisingly, almost all economic data was ignored. It began with the eurozone inflation report, which raised some concerns. These concerns were related to the ECB's future monetary policy actions. German inflation showed a sharp slowdown in December, and many traders expected a significant deceleration in eurozone inflation as well. Had that happened, the likelihood of ECB monetary tightening in 2026 would have dropped to nearly zero. Moreover, a fall in inflation below the central bank's target would have meant that the probability of another rate cut was higher than that of a rate hike. Despite the fact that the consumer price index did not fall below 2%, the risk of further inflation deceleration remains. Price growth in Europe has slowed for the third consecutive month, although in the medium term it has remained close to 2% for about 10 months.
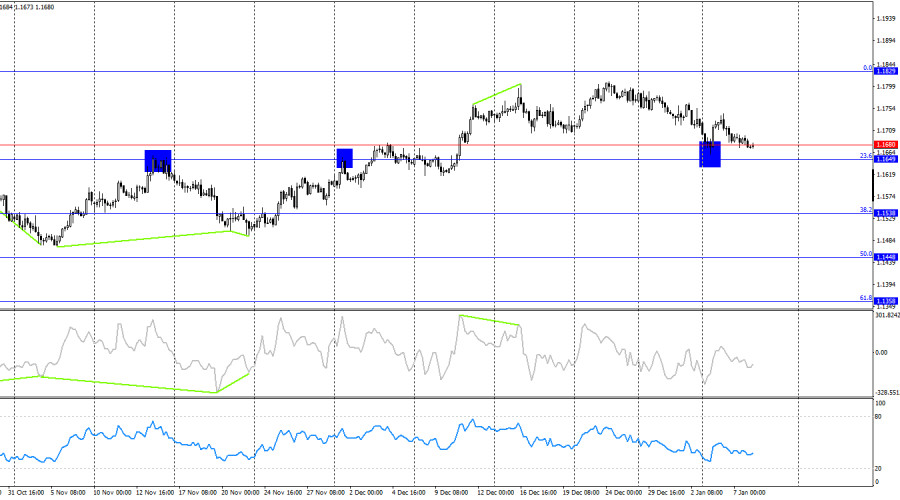
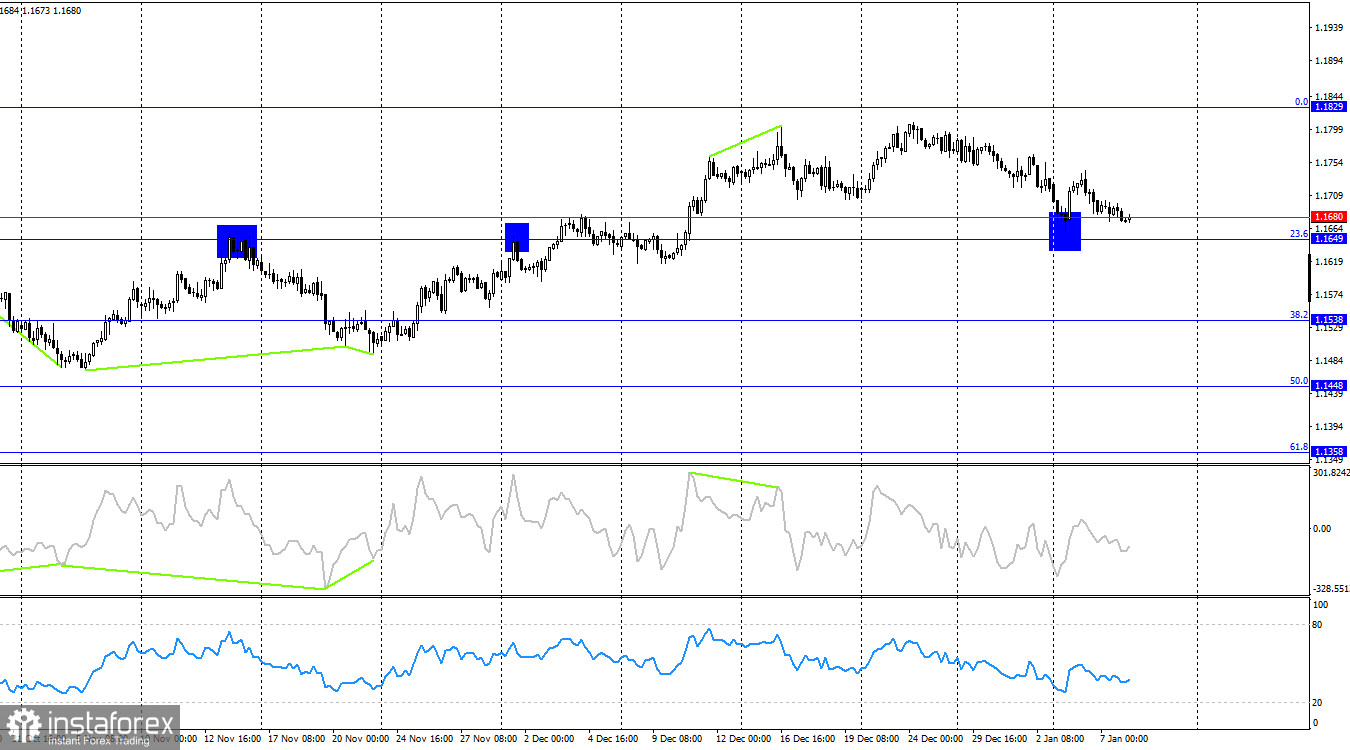
On the 4-hour chart, the pair rebounded from the support level at 1.1649–1.1680 and reversed in favor of the euro. Thus, the growth process may continue toward the 0.0% corrective level at 1.1829. A consolidation below the 1.1649–1.1680 support level would increase the chances of a continued decline toward the next Fibonacci level at 38.2% – 1.1538. No emerging divergences are observed on any indicator today.
Commitments of Traders (COT) report:
During the latest reporting week, professional market participants opened 16,177 long positions and 1,189 short positions. Sentiment among the "non-commercial" group remains bullish thanks to Donald Trump and his policies and continues to strengthen over time. The total number of long positions held by speculators now stands at 293,000, while short positions amount to 133,000. This represents more than a twofold advantage for the bulls.
For thirty-three consecutive weeks, large players reduced short positions and increased longs. Then came the "shutdown," and now we are seeing the same picture again: professional traders continue to build long positions. Donald Trump's policies remain the most significant factor for traders, as they generate numerous issues that are likely to have long-term and structural consequences for the U.S. economy—for example, the deterioration of the labor market. Traders also fear a loss of Federal Reserve independence in 2026 due to pressure from Trump and amid Jerome Powell's expected resignation in May.
News calendar for the U.S. and the eurozone:
- Eurozone – Unemployment rate (10:00 UTC)
- U.S. – Initial jobless claims (13:30 UTC)
On January 8, the economic calendar contains only two entries, neither of which is particularly important. The impact of the news background on market sentiment on Thursday may be extremely weak or entirely absent.
EUR/USD outlook and trading advice:
Selling the pair was possible after a rebound from the 1.1731 level on the hourly chart, with a target at 1.1686. This target has been reached. Today, short positions can be maintained with targets at 1.1645–1.1648 and 1.1607–1.1612. Buying opportunities may arise after a rebound from one or both of these target zones on the hourly chart, with targets at 1.1686 and 1.1731.
Fibonacci grids are drawn from 1.1492–1.1805 on the hourly chart and from 1.1066–1.1829 on the 4-hour chart.