The EUR/USD currency pair continued to trade in a festive mode on Tuesday. There is virtually no movement in the market; the fundamental and macroeconomic background is absent, and the market will close today. Thursday is a holiday. Thus, the current week truly qualifies as a "holiday" week. It is not surprising that traders are in no hurry to open new trades and are thinking more about Olivier salad and champagne than about the prospects for the EUR/USD pair until the end of the year.
We fully support this option, because rest is also necessary. The year was eventful; everyone earned a rest. Fears about a "thin" market and "wild moves" over the New Year holidays did not materialize, which is also very good. We are even somewhat surprised that some analysts are trying to analyze the current "convulsions" in the market and offer forecasts. The market is currently in total flatness. On the daily timeframe, it has persisted for 6 months, and it is worth noting that a flat is not an accidental event. A flat is a period of time when market makers accumulate positions for a new trend or distribute their positions before a trend change.
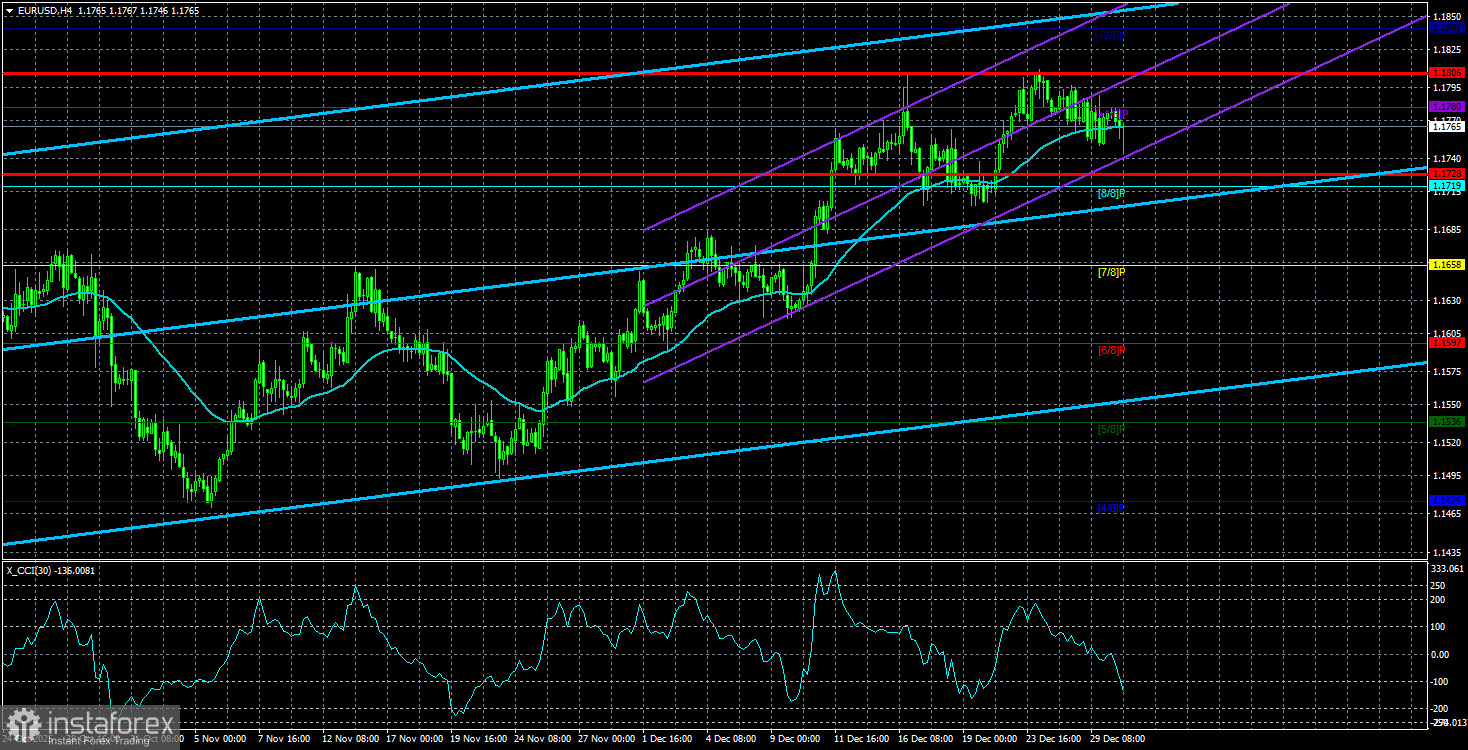
Thus, a flat is an excellent time for opening new positions. We said that a reversal upward should be expected around the 1.1400 level. The price failed to reach 1.1400, but still reversed around it. It has now been trading for several weeks near the upper boundary of the sideways channel 1.1400–1.1830, so we almost do not doubt that a breakout will occur at the beginning of the new year.
On the lower timeframes, also a flat. In fact, one could even say it began on December 12. Recall that during the week of December 15–19, a considerable amount of important information was published in the US, and important central bank meetings were held in the EU and the UK. And all that information proved unworthy of action by traders. Since December 23, we have observed another flat between the levels 1.1750 and 1.1809. Thus, there is essentially nothing to analyze. At the end of the year, the market clearly does not wish to force events.
As for the prospects of the EUR/USD pair, our position remains unchanged — the dollar will fall in 2026 as well. There are no fundamental reasons for its growth in the medium term. Throughout the entire second half of 2025, the dollar was unable to correct against the euro by more than 23.6%. Even that correction was possible thanks to the flat. The European Central Bank does not plan a single round of monetary policy easing next year, while the Fed will almost certainly cut the key rate, and possibly more than once. In addition, do not discount the "Trump factor", weakness of the US labor market, falling inflation in the US, and the change of the Fed chair in May. All these factors will push the dollar to a new decline.
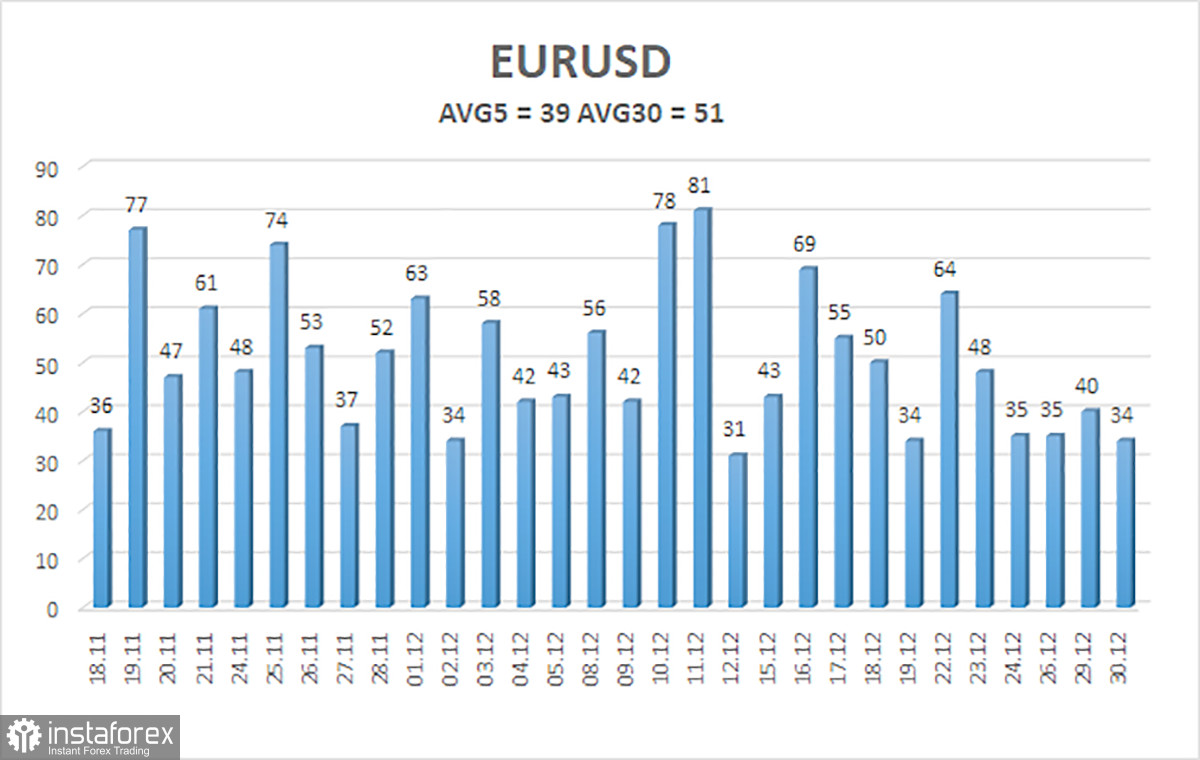
The average volatility of the EUR/USD pair over the last five trading days as of December 31 is 39 pips and is characterized as "low." We expect the pair to move between 1.1728 and 1.1806 on Wednesday. The higher linear regression channel is turning up, but the flat on the daily timeframe persists. The CCI indicator entered the oversold area twice in October (!!!), but in early December, it visited the overbought area. We have already seen a slight pullback.
Nearest support levels:
S1 – 1.1719
S2 – 1.1658
S3 – 1.1597
Nearest resistance levels:
R1 – 1.1780
R2 – 1.1841
Trading recommendations
The EUR/USD pair is above the moving average line; on all higher timeframes, the uptrend is intact, while on the daily timeframe, the flat continues for the sixth month in a row. The global fundamental background still matters greatly for the market, and it remains negative for the dollar. Over the past six months, the dollar has occasionally shown weak growth, but exclusively within the sideways channel. It has no fundamental basis for long-term strengthening. With the price located below the moving average, one can consider small short positions targeting 1.1728 on purely technical grounds. Above the moving average, long positions remain relevant with a target of 1.1830 (the upper line of the flat on the daily TF), which has already effectively been worked out. Now the flat needs to end.
Explanations for the illustrations:
- Linear regression channels help determine the current trend. If both are directed in the same way, the trend is currently strong;
- The moving average line (settings 20,0, smoothed) defines the short-term tendency and the direction in which one should currently trade;
- Murray levels are target levels for moves and corrections;
- Volatility levels (red lines) are the probable price channel in which the pair will spend the next 24 hours, based on current volatility readings;
- The CCI indicator — its entry into the oversold area (below -250) or into the overbought area (above +250) means that a trend reversal in the opposite direction is approaching.