empty
24.02.2025 01:34 AM
NDX – Weekly Results and Future Outlook

This image is no longer relevant

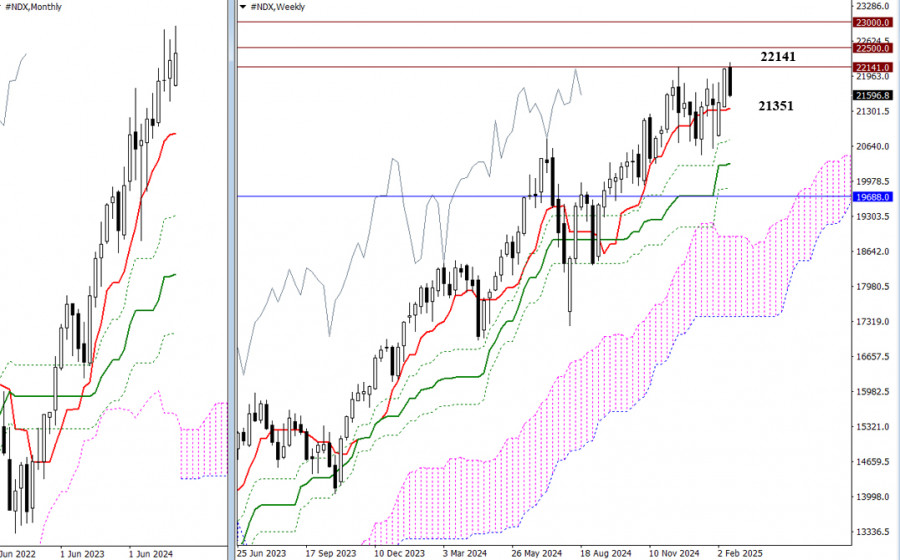
On February 18, a new maximum extreme (22,225) was reached, but the bears took control, resulting in a significant decline by the end of the trading week. Bearish players reclaimed most of the gains achieved by the bulls the day before. If they manage to hold their positions and continue the decline, the subsequent test of the nearest support level at the short-term weekly trend (21,351) may end with a breakout of the Tenkan line and further interact with other levels of the weekly cross.

This image is no longer relevant

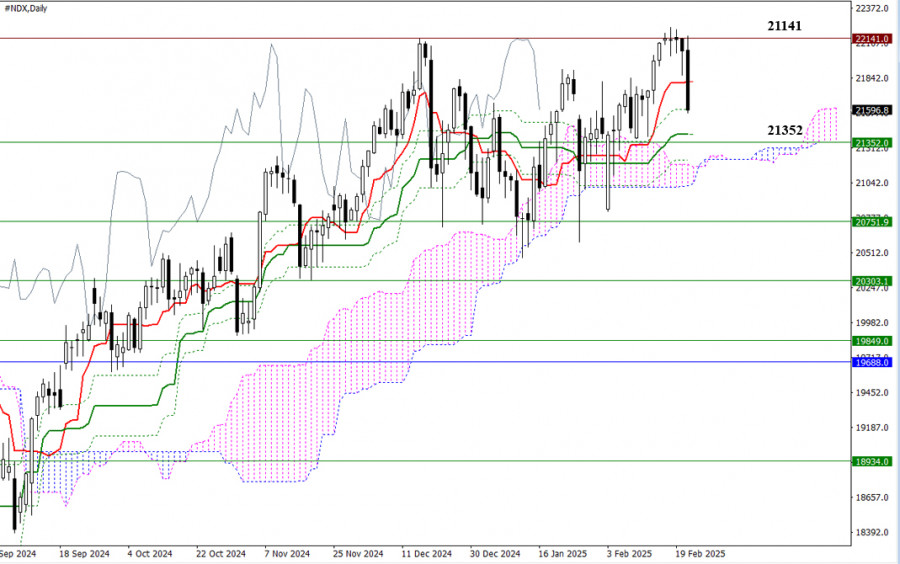
By the end of the trading week, a rebound from the record high (22,141) allowed the market to fall to the support of the daily Fibonacci Kijun (21,604). If bearish sentiment continues to strengthen in the near term, the next tasks will be to eliminate the daily Ichimoku golden cross (21,412 – 21,220), return to the bears' side of the short-term weekly trend (21,352), and break the daily cloud (21,170). However, if bullish players seek a comeback and manage to stop the current decline, they will need to consolidate above the previous week's maximum extreme (22,225) to restore the uptrend on higher timeframes.

This image is no longer relevant

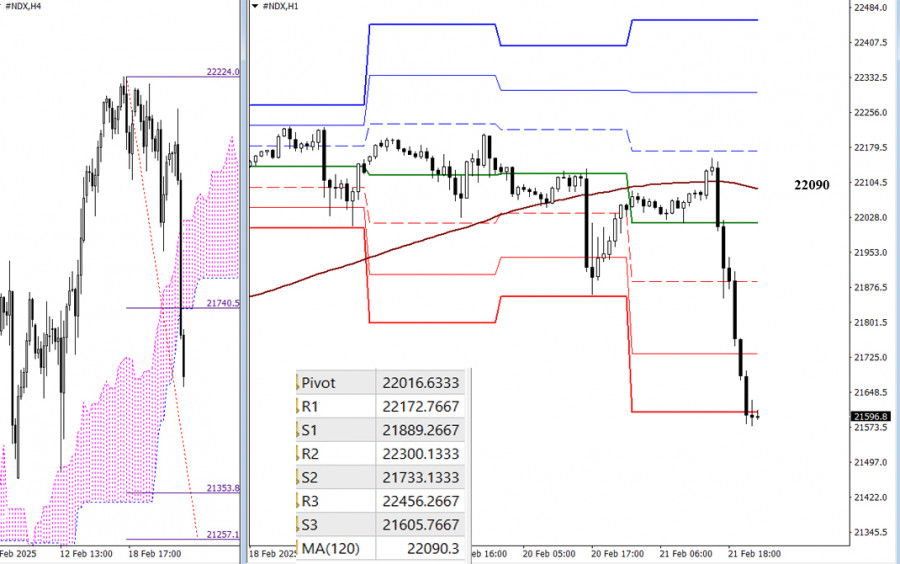
On lower timeframes, bearish players currently hold the main advantage. On H4, a target for a break of the H4 Ichimoku cloud (21,354 – 21,257) has been set for them. Additional intraday downside reference points include the supports of the classic Pivot levels, with updated Pivot values to be revealed at the market open. For the balance of power to shift, bulls must reclaim the key levels – the central Pivot level of the day and the long-term weekly trend (22,090).

***

Technical Analysis Components:
  • Higher Timeframes: Ichimoku Kinko Hyo (9.26.52) and Fibonacci Kijun levels
  • H1: Classic Pivot Points and 120-period Moving Average (weekly long-term trend)
Evangelos Poulakis,
Analytical expert of InstaForex
© 2007-2025
Summary
Urgency
Analytic
Zhizhko Nadezhda
Start trade
Earn on cryptocurrency rate changes with InstaForex
Download MetaTrader 4 and open your first trade
  • Grand Choice
    Contest by
    InstaForex
    InstaForex always strives to help you
    fulfill your biggest dreams.
    JOIN CONTEST

Recommended Stories

Forecast for GBP/USD on September 4, 2025

GBP/USD Twice piercing the 1.3364 support level with the lower shadows of daily candles on Tuesday and Wednesday keeps the bears' optimism alive. If today the price does not return

Laurie Bailey 05:07 2025-09-04 UTC+2

AUD/USD Forecast for September 4, 2025

AUD/USD For the third consecutive day, the Australian dollar has been testing the MACD line with the upper shadows of daily candles. The signal line of the Marlin oscillator

Laurie Bailey 05:07 2025-09-04 UTC+2

Forecast for EUR/USD on September 3, 2025

On Tuesday, EUR/USD reversed in favor of the U.S. dollar and saw a sharp decline, closing below the support zone at 1.1637–1.1645. Thus, the downward move may continue today toward

Samir Klishi 11:11 2025-09-03 UTC+2

Forecast for GBP/USD on September 3, 2025

On the hourly chart, GBP/USD on Tuesday reversed in favor of the U.S. dollar and fell toward the support zone at 1.3357–1.3364. A rebound from this zone today will work

Samir Klishi 10:57 2025-09-03 UTC+2

GBP/USD. Indicator Analysis on September 3, 2025

On Tuesday, the pair moved downward, tested the 50% retracement level at 1.3366 (yellow dotted line), and then moved upward, closing the daily candle at 1.3391. Today, the price

Stefan Doll 10:48 2025-09-03 UTC+2

EUR/USD. Indicator Analysis on September 3, 2025

On Tuesday, the pair moved downward, tested the support line at 1.1613 (thick blue line), and then moved up, closing the daily candle at 1.1638. Today, the price may continue

Stefan Doll 10:42 2025-09-03 UTC+2

If the Pivot level can hold the correction in XPD/USD, it has the potential to strengthen and rise towards its nearest resistance level. Wednesday, September 03, 2025.

[XPD/USD] – [Wednesday, September 03, 2025] XPD/USD has a Death Cross crossing the EMAs. Although the RSI is at a neutral bearish level, as long as it doesn't weaken

Arief Makmur 09:54 2025-09-03 UTC+2

Natural gas has the potential to weaken today, falling to its nearest support level. Wednesday, September 03, 2025.

[Natural Gas] – [Wednesday, September 03, 2025] With EMA (50) position above the EMA (200) and the RSI indicator in the Neutral Bullish area today, #NG has the potential

Arief Makmur 09:54 2025-09-03 UTC+2

EUR/USD Forecast for September 3, 2025

EUR/USD After yesterday's spike in yields on European government bonds, the drop in the EuroStoxx50 stock index by 1.41% (DAX -2.29%), and the euro's fall by 0.67% with the perfect

Laurie Bailey 05:51 2025-09-03 UTC+2

GBP/USD Forecast for September 3, 2025

GBP/USD The UK Treasury's intention to raise taxes and the strengthening of the US dollar by 0.67% led to a 1.20% drop in the pound (148 pips). On the weekly

Laurie Bailey 05:51 2025-09-03 UTC+2
Can't speak right now?
Ask your question in the chat.
Widget callback
 

Dear visitor,

Your IP address shows that you are currently located in the USA. If you are a resident of the United States, you are prohibited from using the services of InstaFintech Group including online trading, online transfers, deposit/withdrawal of funds, etc.

If you think you are seeing this message by mistake and your location is not the US, kindly proceed to the website. Otherwise, you must leave the website in order to comply with government restrictions.

Why does your IP address show your location as the USA?

  • - you are using a VPN provided by a hosting company based in the United States;
  • - your IP does not have proper WHOIS records;
  • - an error occurred in the WHOIS geolocation database.

Please confirm whether you are a US resident or not by clicking the relevant button below. If you choose the wrong option, being a US resident, you will not be able to open an account with InstaForex anyway.

We are sorry for any inconvenience caused by this message.