EUR/USD continued to trade erratically or shows flat dynamics. Recall that the price had been trading in a horizontal channel between approximately 1.0681 and 1.0742 for about two weeks. On Monday, during the night session, the pair sharply increased but returned to its original positions by the second half of the day. We eventually found out that this was the market's reaction to the results of the parliamentary elections in France, where Marine Le Pen's far-right party received fewer votes than expected.
We believe that political events should not strongly influence the currency market, but this does happen from time to time. However, Monday saw the release of much more important macro data but it didn't provoke a significant market reaction. Reports on inflation in Germany and the ISM manufacturing activity in the US were ignored. Once again, we saw very strange market behavior.
On Tuesday, the economic reports were even more interesting, but the market again showed us that 40-50 pips of volatility is currently the maximum value it can manage. Annual inflation in the Eurozone dropped to 2.5% in June, down from 2.6% in May, as expected, but at the same time, core inflation missed estimates by not easing to 2.8%. The market practically ignored this report, and we would like to remind you how it showed a significant reaction to a minor slowdown in US inflation as it sold the dollar by 100 pips.
However, we warned you that European inflation is no longer as important for the euro as it was a few months ago. The market has already realized that the European Central Bank has started easing monetary policy and will likely continue to do so "every two meetings." Even if the actual pace is slightly different, it does not change the outlook for the euro. The single currency should head downwards, at least until the Federal Reserve starts lowering its key rate. The pause of the last few weeks does not yet seem strange or overly prolonged, but we're facing a period where the pair shows flat dynamics. There would be no questions if the pair showed a strong trend between such periods. However, what do we see in reality? Super-slow trends with the same low volatility, followed by several weeks of a flat phase. Globally, the market continues to be dormant.
The Eurozone inflation report did not provide us with any new information. It only showed that everything is going according to plan and that the accelerated pace in May was just an isolated case. Thus, the ECB will likely lower rates for the second time in September, and the euro should continue to fall if we're talking about logical and consistent movements. Several economic reports will be published this week, but the first two days have shown us that the market is reluctant to trade actively and sell the pair aggressively.
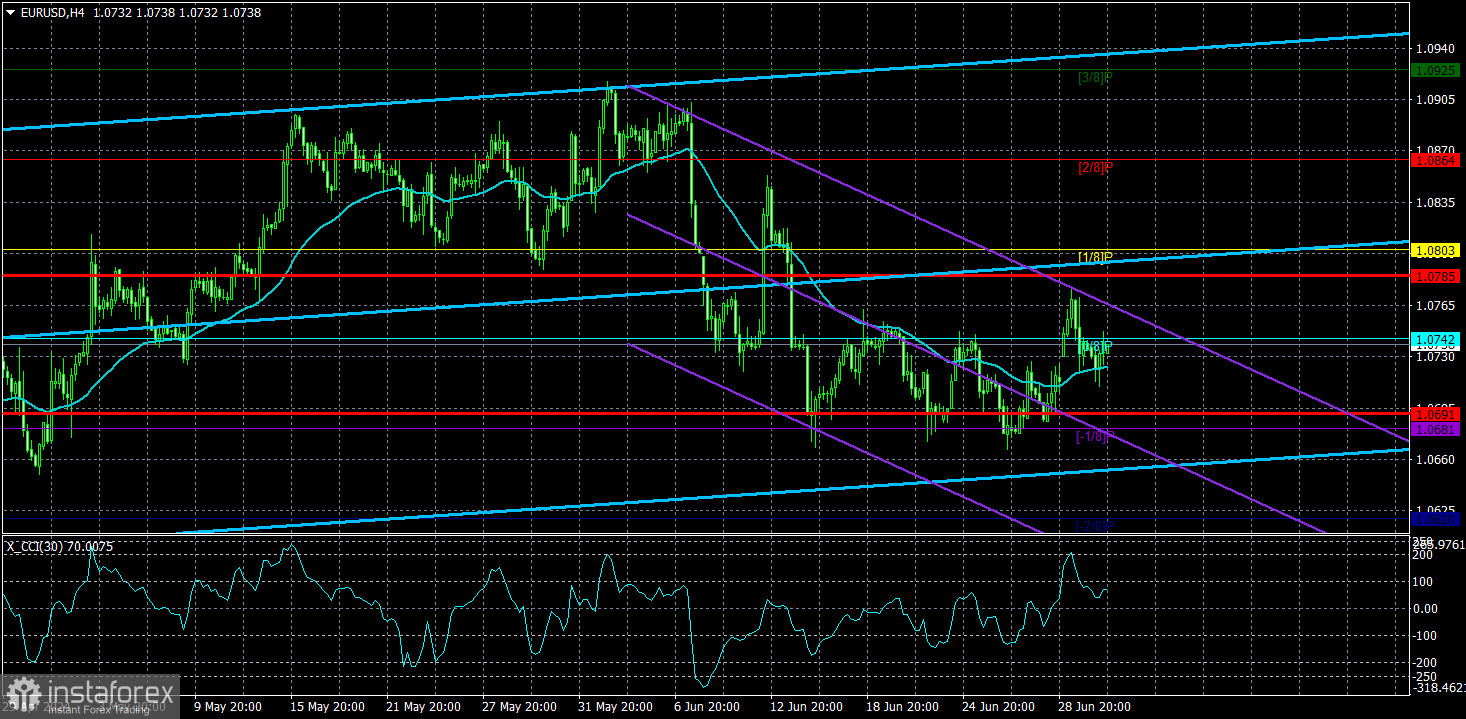
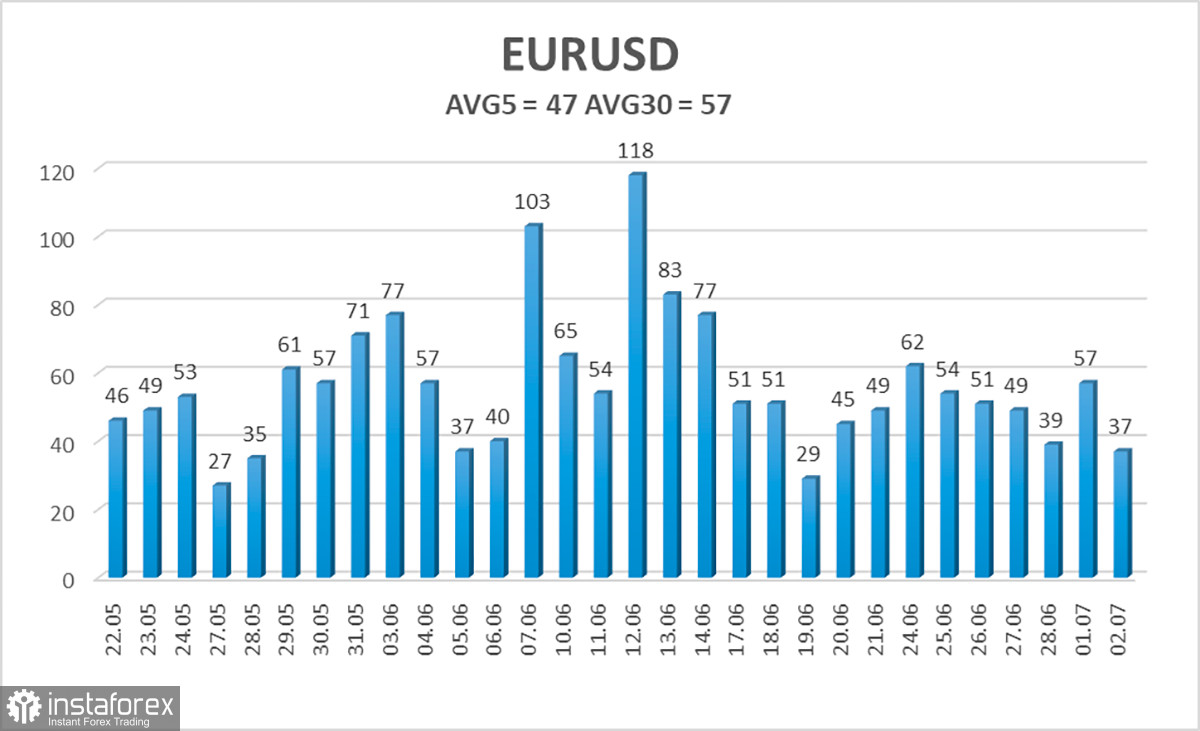
The average volatility of the EUR/USD pair over the last five trading days as of July 3 is 47 pips, which is considered a low value. We expect the pair to move between 1.0691 and 1.0785 on Wednesday. The higher linear regression channel is directed upwards, but the global downtrend remains intact. The CCI indicator entered the oversold area, but it has already been worked out by a bullish correction.
Nearest support levels:
S1 - 1.0681
S2 - 1.0620
S3 - 1.0559
Nearest resistance levels:
R1 - 1.0742
R2 - 1.0803
R3 - 1.0864
Trading Recommendations:
The EUR/USD pair maintains a global downtrend, and the price is located above the moving average on the 4-hour timeframe. In previous reviews, we said that we are waiting for the continuation of the downward trend. At this time, short positions remain valid, but the corrective move may continue. The third consecutive rebound from 1.0681 provoked another round of the bullish correction. We don't recommend buying the euro, as we believe that the global downtrend has resumed, and the single currency has no grounds for growth. But the price may rise for some time as part of the correction. Especially this week, when no one knows what the data from the EU and US will turn out to be.
Explanation of the chart:
- Linear Regression Channels – Helps determine the current trend. If both are directed in the same direction, it means the trend is currently strong.
- Moving Average Line (settings 20.0, smoothed) – Determines the short-term trend and the direction in which trading should currently be conducted.
- Murray Levels – Target levels for movements and corrections.
- Volatility Levels (red lines) – The probable price channel in which the pair will spend the next day, based on current volatility indicators.
- CCI Indicator – Its entry into the oversold area (below -250) or the overbought area (above +250) means that a trend reversal in the opposite direction is imminent.