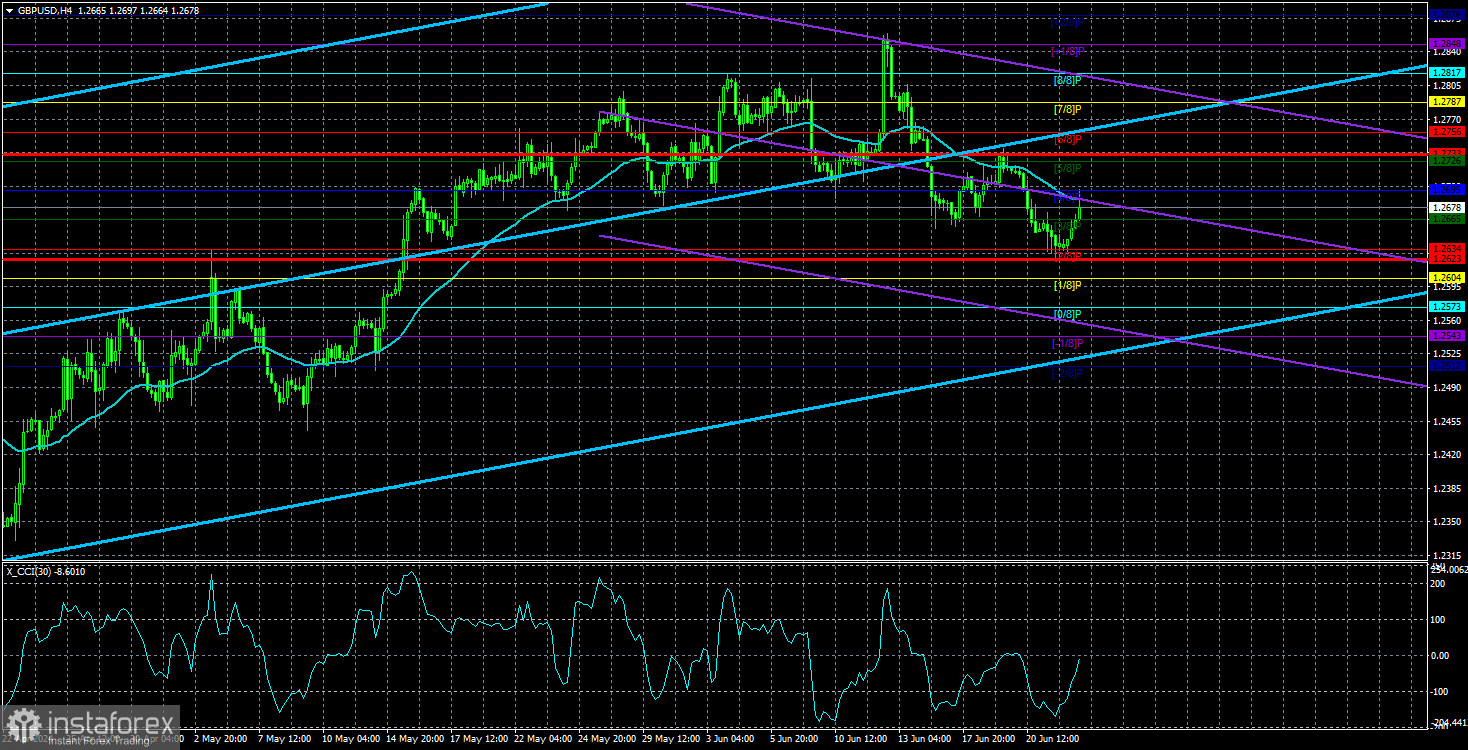
GBP/USD also traded quite calmly on Monday. The pair's volatility has left much to be desired for a very long time. Over the past five days, we have observed movements that average around 50 pips. It is worth noting that the market rarely moves in one direction every day. Therefore, it may take two weeks to reach the 1.2500 level. The 1.2500 level is one of the lows of the four-month flat observed at the beginning of the year. After the pair fell to the 1.2300 level several months ago, but failed to overcome the 61.8% Fibonacci level (1.2763) on the 24-hour chart three times, we believe that the 1.2500 level is a very logical target.
Of course, in the long term, we expect the price to drop to the 1.2300 level and maybe even lower. It is worth noting that the Bank of England will start monetary easing earlier than the Federal Reserve, and no one knows the outcome of the parliamentary elections in the UK. The market doesn't like uncertainty, and it remembers the last change of power in Britain. Liz Truss didn't stay in power for long, but the pound managed to crash to record lows. Now, however, the balance of power in Parliament will likely change. The Labour Party will take the lead as all preliminary votes have shown that few want to vote for the Conservatives. Thus, the change of power and the upcoming easing of monetary policy by the BoE are enough grounds for the British currency to fall.
Unfortunately, market makers and the BoE might be able to prevent the pound from falling. Over the past six months, we saw the pound resist the decline, even though all factors pointed to it. However, we can now reasonably consider that the pound is in a global flat between the levels of 1.23 and 1.28, which is clearly visible on the 24-hour TF. If the price doesn't overcome the upper boundary once again, then the price will move towards the lower boundary for some time.
This week, the fundamentals and macroeconomics in the UK and the US will be very weak. We can, of course, take note of the GDP reports in both countries, but these are not the data that can change the overall market sentiment or provoke an immediate reaction of 100 pips. Other macroeconomic reports are even weaker. They can cause a market reaction within the day of 30-40 pips at best. Thus, on the 4-hour TF, the pair may rise by 100 pips or so in the near future as part of another corrective wave before a new downward wave with a target of 1.2500. Since the BoE and the Fed are not yet ready to take serious actions, we do not expect significant changes in the GBP/USD pair.
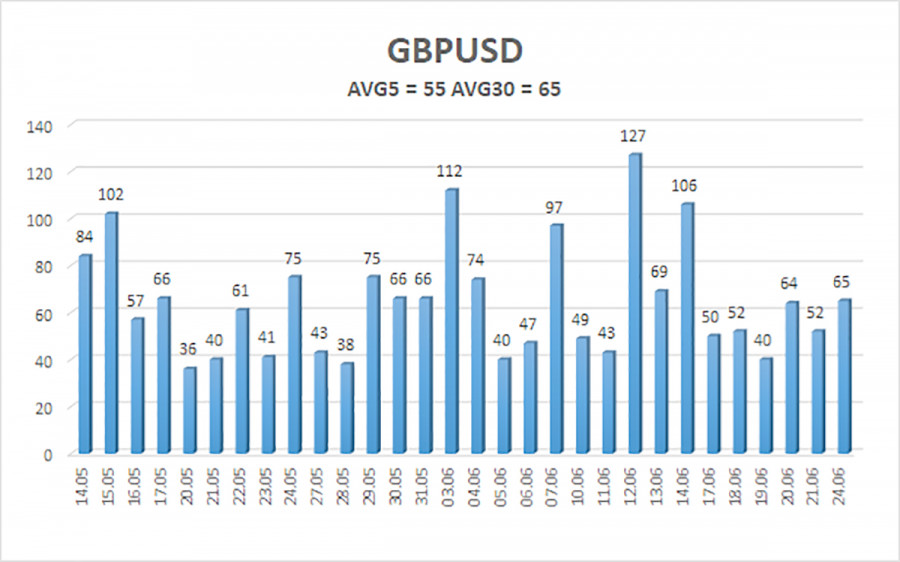
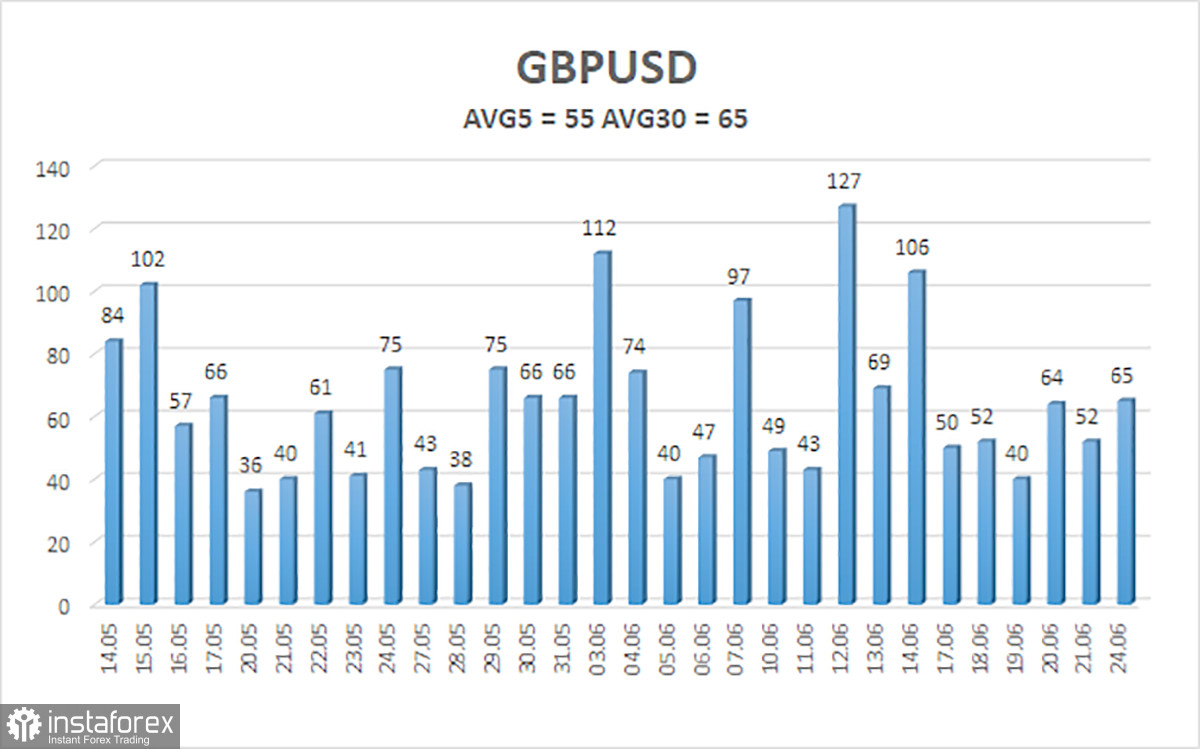
The average volatility of GBP/USD over the last five trading days is 55 pips. This is considered a moderately low value for the pair. Today, we expect GBP/USD to move within a range bounded by the levels of 1.2623 and 1.2733. The higher linear regression channel is pointing upwards, which suggests that the upward trend will continue. The CCI indicator entered the oversold area three times in the month before last, and the British currency started a new phase of growth. However, this correction has presumably ended. There are no new entries into the overbought and oversold areas.
Nearest support levels:
S1 - 1.2634
S2 - 1.2604
S3 - 1.2573
Nearest resistance levels:
R1 - 1.2665
R2 - 1.2695
R3 - 1.2726
Trading Recommendations:
The GBP/USD pair has once again consolidated below the moving average line and is trying to break the upward trend of the previous months. Therefore, after consolidating below the moving average line and overcoming the area of 1.2680-1.2695, the chances of a further fall have significantly increased. However, traders should be cautious with any positions on the British currency. There is still no reason to buy it, and it is also dangerous to sell it, because the market ignored the fundamental and macroeconomic background for two months, and often simply refused to sell the pair. We saw a vivid confirmation of this last week, when the market simply ignored the inflation report and the BoE meeting. Nevertheless, only short positions are valid, if we are talking about a logical and natural movement.
Explanation of Illustrations:
- Linear Regression Channels – Helps determine the current trend. If both are directed in the same direction, it means the trend is currently strong.
- Moving Average Line (settings 20.0, smoothed) – Determines the short-term trend and the direction in which trading should currently be conducted.
- Murray Levels – Target levels for movements and corrections.
- Volatility Levels (red lines) – The probable price channel in which the pair will spend the next day, based on current volatility indicators.
- CCI Indicator – Its entry into the oversold area (below -250) or the overbought area (above +250) means that a trend reversal in the opposite direction is imminent.