Analysis of Friday's deals:
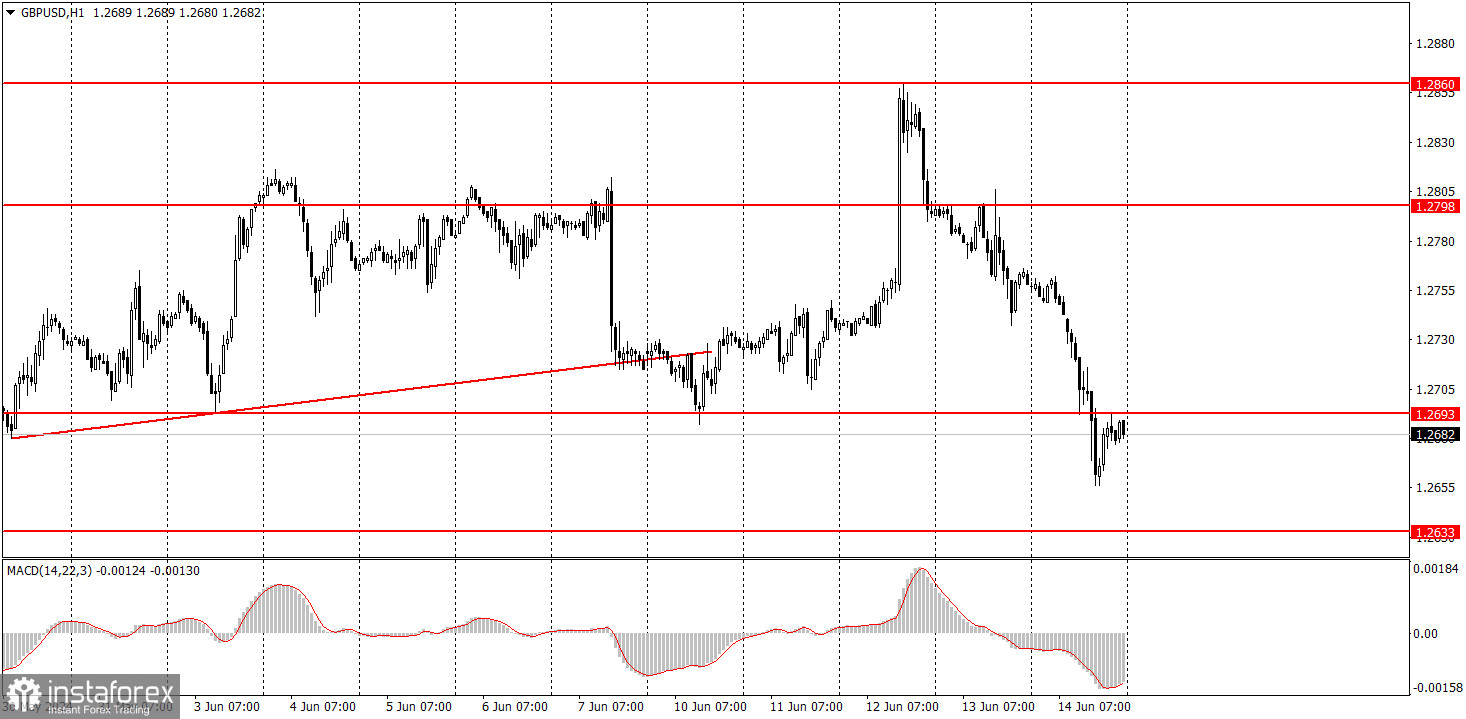
1H chart of the GBP/USD pair.
The GBP/USD pair also showed a fairly strong drop on Friday, for which there were no local reasons. Let's explain what we mean. Local causes are events and news during the day. There were practically none on Friday. In the United States, the consumer sentiment index from the University of Michigan was published, which turned out to be worse than forecasts and eventually stopped the growth of the dollar. However, the downward movement before this publication was not provoked by the news of the day.
However, the general decline in the British currency is natural and logical. Moreover, it should be much stronger than what we have seen recently. The market is still not eager to sell the pound, so important events, such as the Fed meeting with frankly "hawkish" results, remain unprocessed. It is already good for the pound to have overcome the level of 1.2693, which acts as an approximate boundary of the side channel for the last three weeks. If it remains below this level, the probability of further decline increases dramatically.
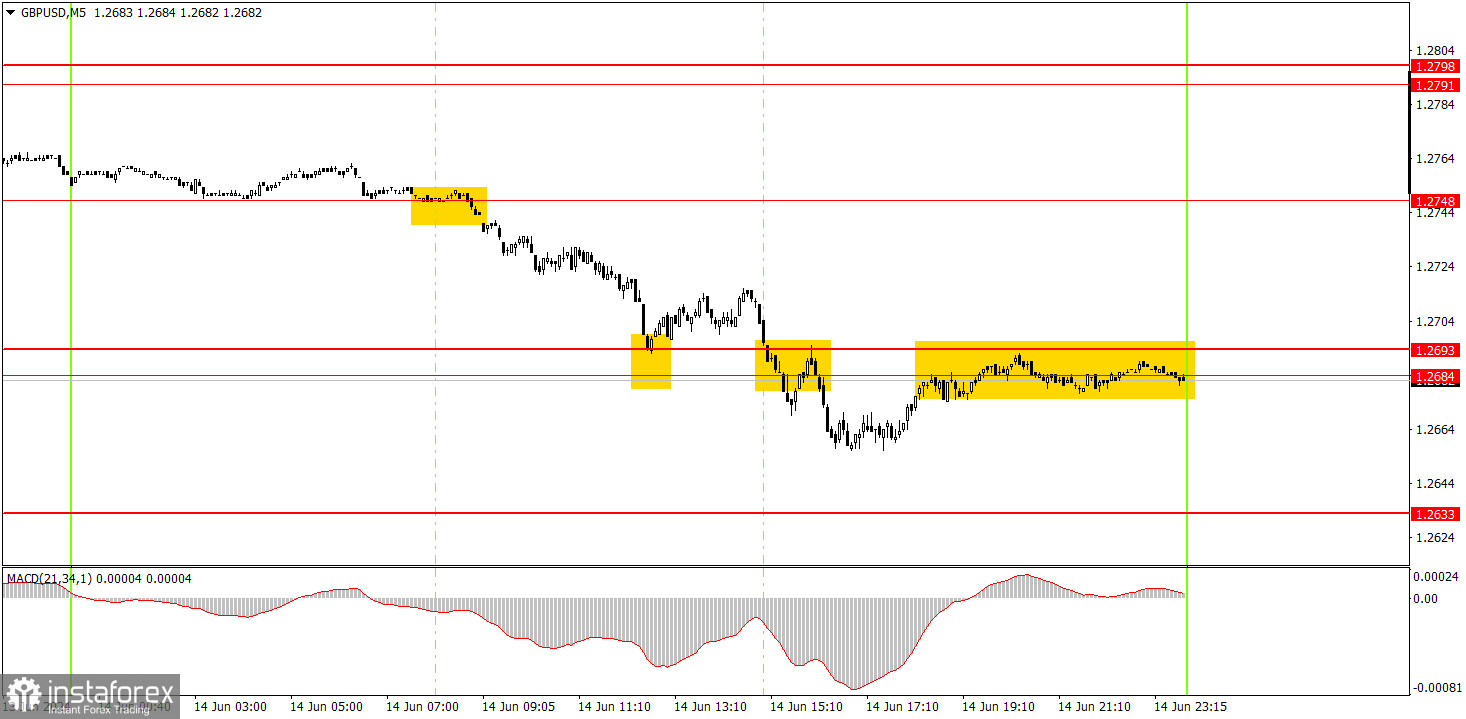
5M chart of the GBP/USD pair.
Several trading signals were generated on the 5-minute TF on Friday. At the beginning of the European trading session, the price settled below the level of 1.2748, which allowed the opening of short positions. The rebound from the 1.2693 level called for them to close. It was possible to open long positions using a buy signal near the 1.2693 level, but this signal was false and brought a small loss. The price further consolidated below the area of 1.2684-1.2693, allowing new short positions to be opened. Still, the consumer sentiment index from the University of Michigan was published a little later. And it is no longer expected that the pair will move down. Therefore, the sales orders should have been closed manually for a small profit.
How to trade on Friday:
On the hourly TF, the GBP/USD pair retains excellent prospects for the formation of a downtrend, but the upward trend persists. For the prospects of the pair's fall, it is very good that the price managed to overcome the level of 1.2693 on Friday. However, it should be remembered that this is only one level, and the market has often refused to sell the pair for more than six months, even if there are all the necessary reasons for this.
On Monday, we advise novice traders to monitor the 1.2684-1.2693 area closely. If the pair fails to gain a foothold above it, the probability of a new fall will be very high.
On the 5-minute TF, you can now trade by levels 1,2457, 1,2502, 1,2541-1,2547, 1,2605-1,2633, 1,2684-1,2693, 1,2748, 1,2791-1,2798, 1,2848-1,2860, 1,2913, 1,2980. No major events are scheduled for Monday in the UK and the US. Therefore, volatility is likely to be low, and movements are weak.
The basic rules of the trading system:
1) The strength of the signal is calculated by the time it took to generate the signal (rebound or overcome the level). The less time it took, the stronger the signal.
2) If two or more trades were opened near a certain level on false signals, all subsequent signals from this level should be ignored.
3) In a flat, any pair can form many false signals or not form them at all. But in any case, it is better to stop trading at the first signs of a flat.
4) Trade transactions are opened between the beginning of the European session and the middle of the American session, after which all transactions must be closed manually.
5) On the hourly TF, using signals from the MACD indicator, it is advisable to trade if there is good volatility and a trend confirmed by a trend line or a trend channel.
6) If two levels are located too close to each other (from 5 to 20 points), they should be considered an area of support or resistance.
7) When passing 20 points in the right direction, you should set the Stop Loss to breakeven.
What's on the chart:
Price support and resistance levels are the targets when opening purchases or sales. Take Profit levels can be placed near them.
Red lines are channels or trend lines that display the current trend and show which way it is preferable to trade now.
The MACD indicator(14,22,3) is a histogram and a signal line – an auxiliary indicator that can also be used as a signal source.
Important speeches and reports (always contained in the news calendar) can greatly influence the movement of a currency pair. Therefore, during their exit, it is recommended that they trade as carefully as possible or exit the market to avoid a sharp price reversal against the previous movement.
Beginners in the forex market should remember that every trade cannot be profitable. Developing a clear strategy and money management is the key to success in trading over a long period.