Analyzing Monday's trades:
GBP/USD on 1H chart
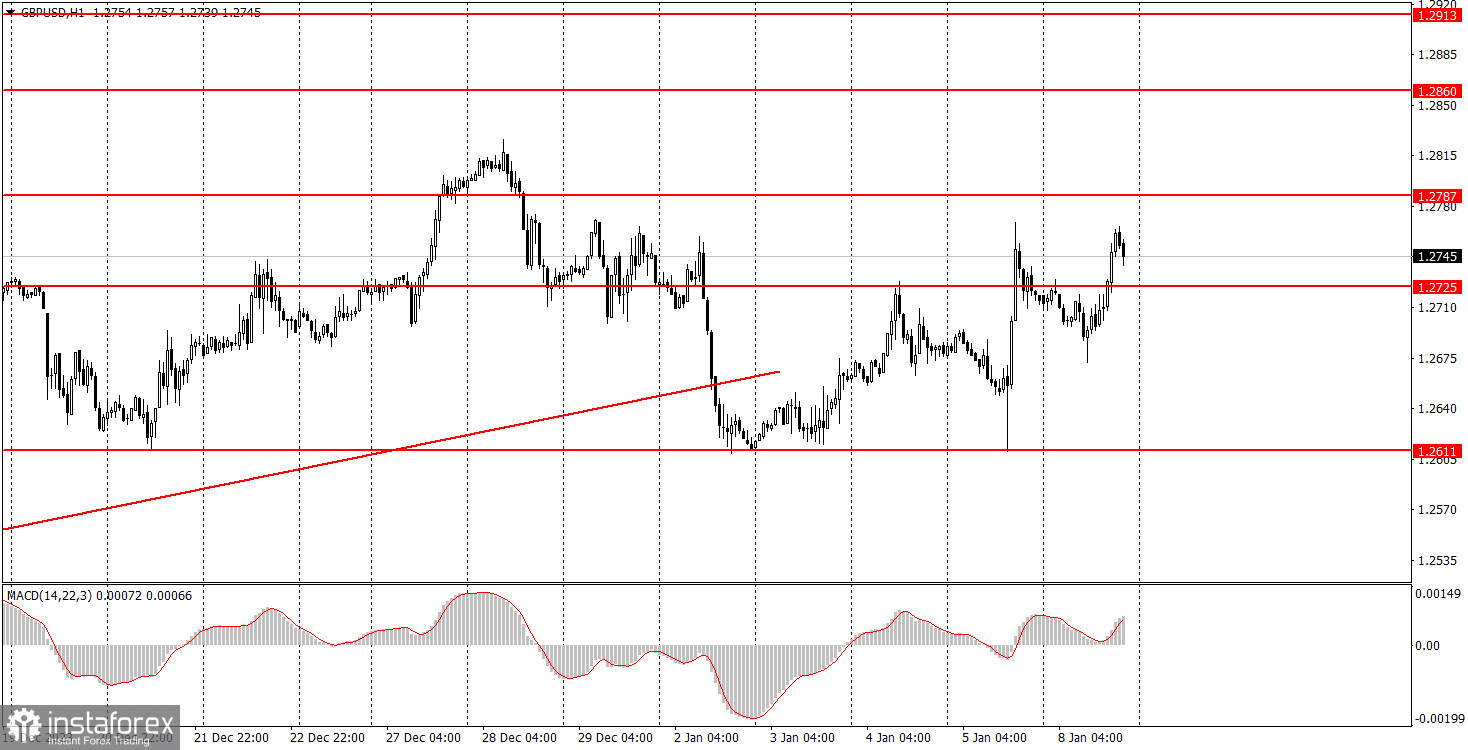
GBP/USD traded higher at the end of the first trading day of the new week. There were absolutely no reasons or grounds for this, as the event calendars for both the UK and the US were completely empty. Nevertheless, the market found a reason to buy the British pound, so it is rising again.
The market did not have any reason to buy the pound on Friday, as the economic reports mostly supported the US dollar rather than the pound. But, as we have repeatedly mentioned, the market isn't showing a strong interest to buy the dollar, so regardless of the fundamental and macroeconomic backdrop, the pair refuses to start a downward movement.
The market still believes that the Federal Reserve will begin to ease monetary policy as early as March, although the probability of this has started to decrease recently. However, while the probability of a policy shift may be decreasing, the GBP/USD pair is not. We still believe that the pound does not have any reason to rise, and the current upward movement (which has been ongoing for three months) is a correction, but the market still refuses to sell the pair. And there is nothing we can do about it.
GBP/USD on 5M chart
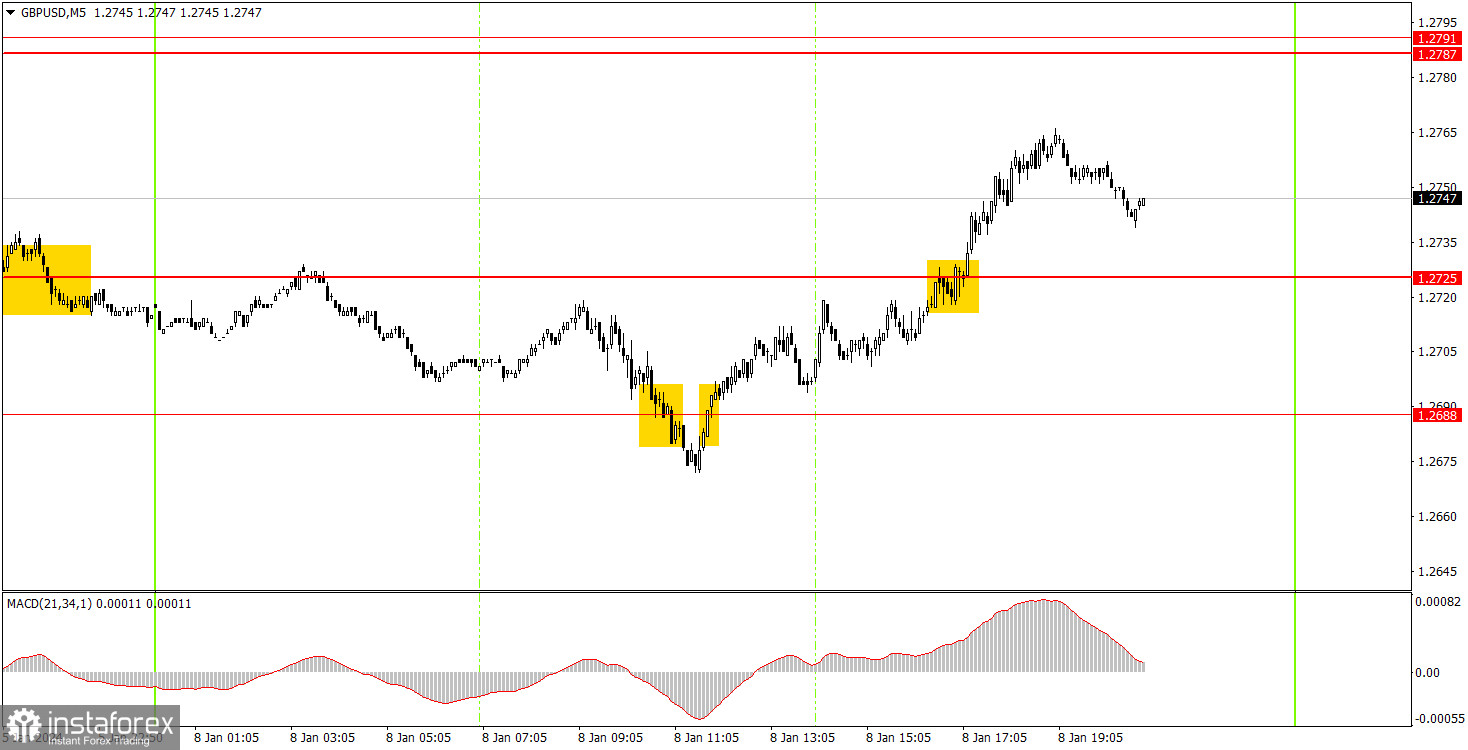
Only three trading signals were generated on the 5-minute chart. The first signal around the level of 1.2688 turned out to be false, resulting in a small loss, as the price couldn't even move 20 pips in the intended direction. However, the next buy signal around the same level turned out to be correct, and the price subsequently rose to the nearest target at 1.2725, surpassing it.
By the end of Monday evening, no new sell signals had been formed, so long positions can be closed manually. Profit amounted to around 50 pips, which offset the loss from the first trade and made it possible for beginners to end the day with a small profit.
Trading tips on Tuesday:
On the hourly chart, GBP/USD broke the trendline and now, for the first time in a long while, has a real chance of forming a new downtrend. However, traders have not been able to break through the 1.2611 level in three attempts, so the downward movement was postponed once again. Currently, the pound is rising without a clear reason.
You can expect the pound to aim for the level of 1.2787. With the current market sentiment, the pair can move in any direction, but when it comes to fundamental and macroeconomic factors, there are currently no news or events, making it difficult to explain why the pound is rising, especially considering the fact that it is already trading near its highest levels in almost six months. We will consider a bounce from the level of 1.2787 as a sell signal.
The key levels on the 5M chart are 1.2270, 1.2310, 1.2372-1.2387, 1.2457, 1.2502, 1.2544, 1.2605-1.2611, 1.2688, 1.2725, 1.2787-1.2791, 1.2848-1.2860, 1.2913, 1.2981-1.2993. On Tuesday, there are no reports or events lined up in either the UK or the US. There will be nothing for the market to react to throughout the day.
Basic trading rules:
1) Signal strength is determined by the time taken for its formation (either a bounce or level breach). A shorter formation time indicates a stronger signal.
2) If two or more trades around a certain level are initiated based on false signals, subsequent signals from that level should be disregarded.
3) In a flat market, any currency pair can produce multiple false signals or none at all. In any case, the flat trend is not the best condition for trading.
4) Trading activities are confined between the onset of the European session and mid-way through the U.S. session, after which all open trades should be manually closed.
5) On the 30-minute timeframe, trades based on MACD signals are only advisable amidst substantial volatility and an established trend, confirmed either by a trendline or trend channel.
6) If two levels lie closely together (ranging from 5 to 15 pips apart), they should be considered as a support or resistance zone.
How to read charts:
Support and Resistance price levels can serve as targets when buying or selling. You can place Take Profit levels near them.
Red lines represent channels or trend lines, depicting the current market trend and indicating the preferable trading direction.
The MACD(14,22,3) indicator, encompassing both the histogram and signal line, acts as an auxiliary tool and can also be used as a signal source.
Significant speeches and reports (always noted in the news calendar) can profoundly influence the price dynamics. Hence, trading during their release calls for heightened caution. It may be reasonable to exit the market to prevent abrupt price reversals against the prevailing trend.
Beginners should always remember that not every trade will yield profit. Establishing a clear strategy coupled with sound money management is the cornerstone of sustained trading success.