Analysis of GBP/USD 5M
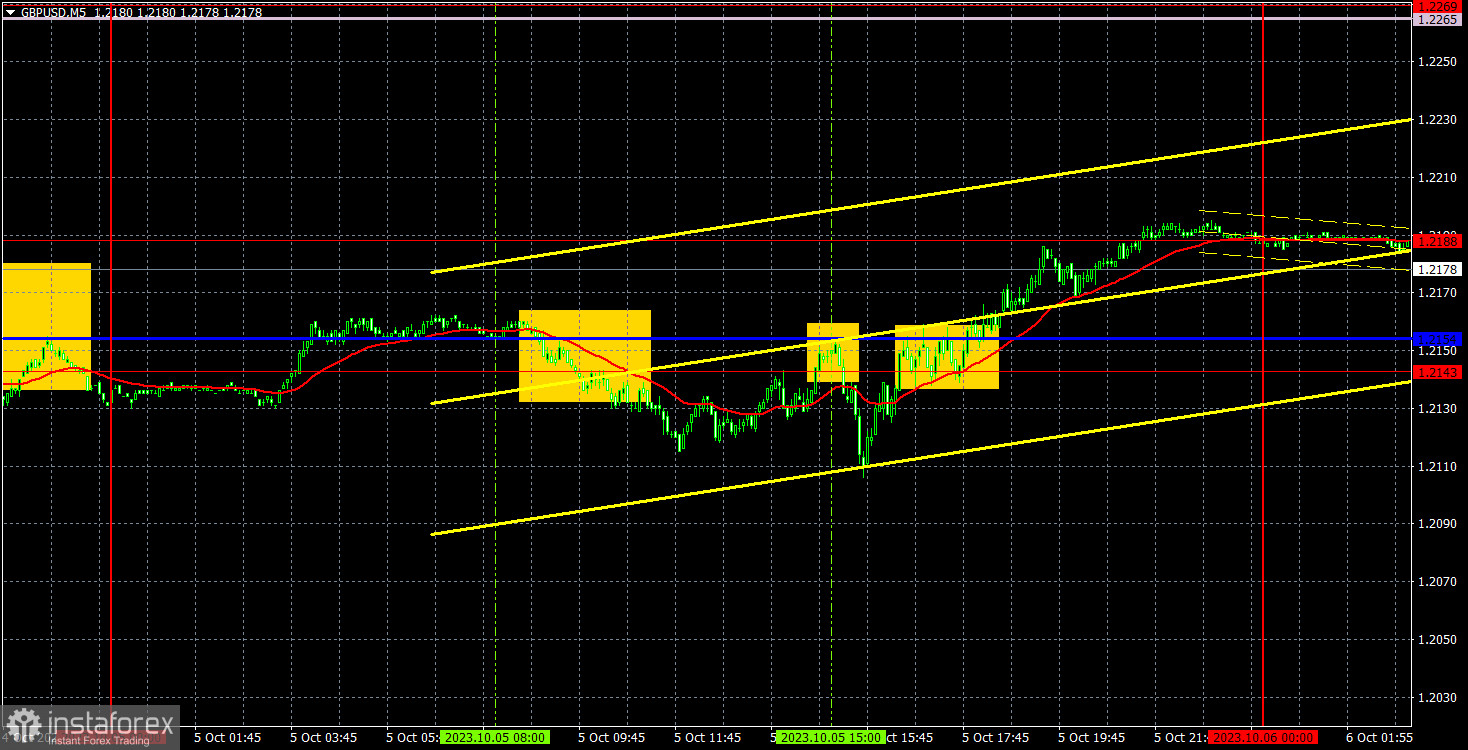
GBP/USD continued to correct higher on Thursday. The British pound had no specific reasons to rise yesterday, but as we've mentioned before, technical corrections don't necessarily require fundamental drivers. That's why it's considered a "technical" correction. Therefore, it's more like the dollar fell as it has been actively appreciating over the past two months, gaining around 1000 pips. There were hardly any economic reports on Thursday, and fundamental events have assumed a background position.
Several trading signals were formed yesterday, but the movement closely resembled a flat market. At the beginning of the European session, the price bounced from the 1.2143-1.2154 range, and it did so again at the start of the US session. In the first case, the price couldn't even fall by 20 pips, so when the second signal was formed, you should have opened a short position. In the second case, the price fell by 20 pips but then it returned to the range where the signal was formed. Therefore, the short position was closed with a Stop Loss to break-even. The third buy signal should not have been executed, but even if some traders did, it still turned out to be profitable.
COT report:
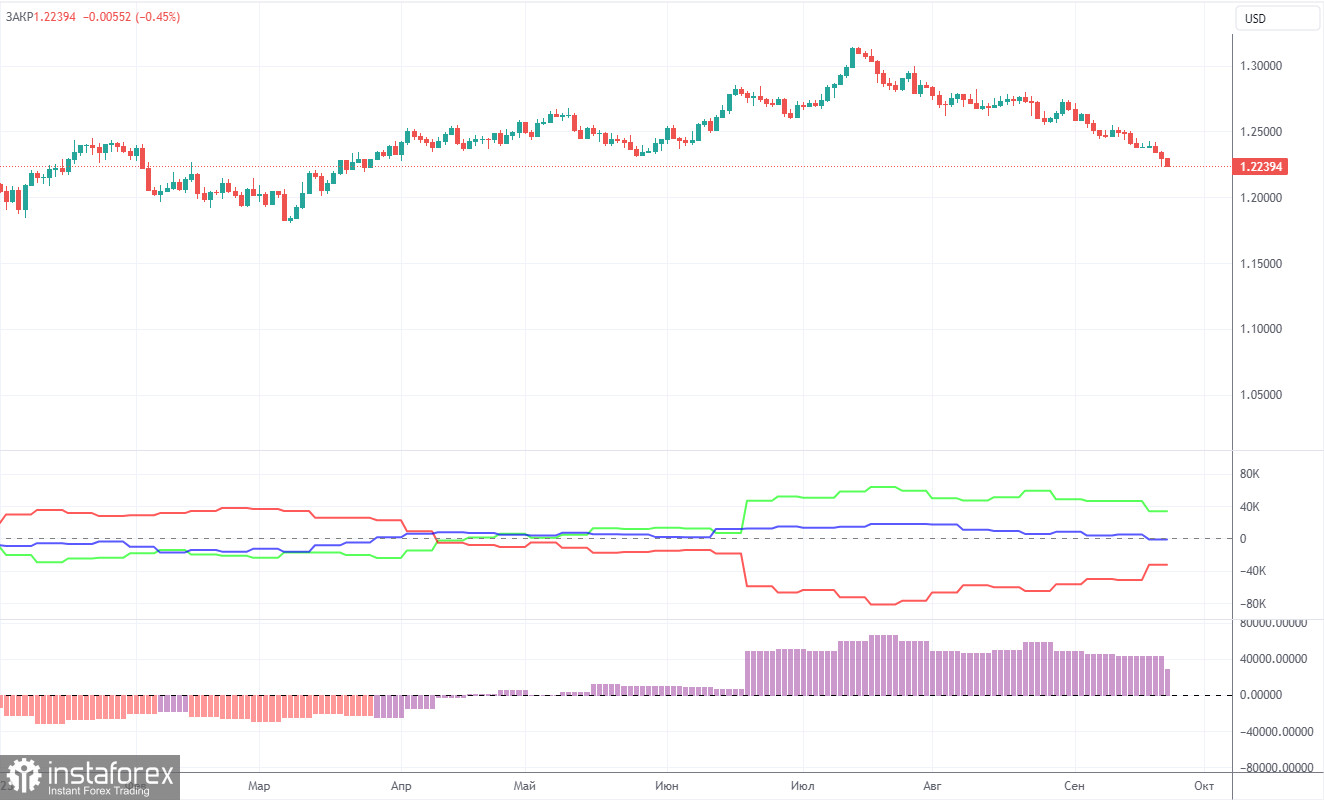
According to the latest report on GBP/USD, the non-commercial group closed 300 long positions and opened 17,700 short ones. Thus, the net position of non-commercial traders decreased by another 18,000 contracts in a week. The net position indicator has been steadily rising over the past 12 months, but it has been firmly decreasing over the past two months. The British pound is also losing ground. We have been waiting for many months for the sterling to reverse downwards. Perhaps GBP/USD is at the very beginning of a prolonged downtrend. At least in the coming months, we do not see significant prospects for the pound to rise.
The British pound has surged by a total of 2,800 pips from its absolute lows reached last year, which is an enormous increase. Without a strong downward correction, a further upward trend would be entirely illogical (if it is even planned). We don't rule out an extension of an uptrend. We simply believe that a substantial correction is needed first, and then we should assess the factors supporting the US dollar and the British pound. A correction to the level of 1.1843 would be sufficient to establish a fair equilibrium between the two currencies. The non-commercial group currently holds a total of 84,700 longs and 69,000 shorts. The bears have been holding the upper hand in recent months, and we believe this trend will continue in the near future.
Analysis of GBP/USD 1H
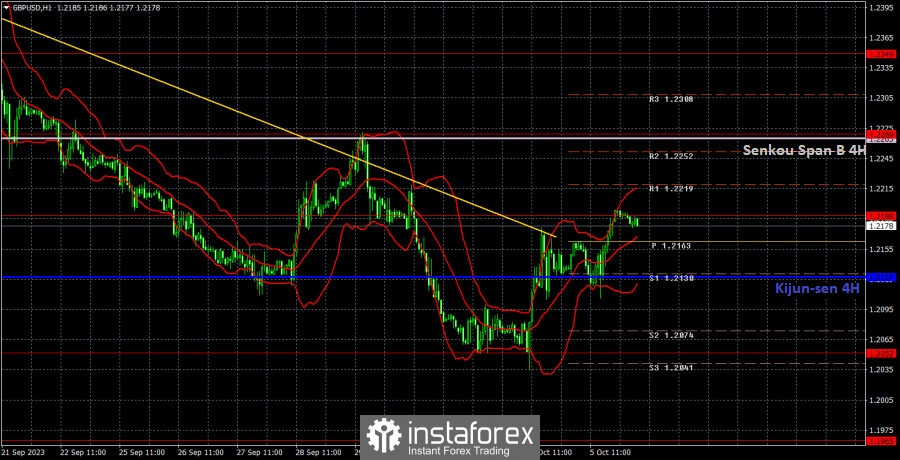
On the 1H chart, GBP/USD quickly ended its long-awaited bullish correction but has already started a new one. The pound, as before, is poised to go downward. So, we do not believe that its decline in 2023 is over. The only thing is that we would have preferred to see a stronger correction than what we ultimately saw. At present, the pair has surpassed the trendline, and it has also breached the Kijun-sen line, so we can expect further growth towards the Senkou Span B line.
As of October 6, we highlight the following important levels: 1.1760, 1.1874, 1.1927-1.1965, 1.2052, 1.2188, 1.2269, 1.2349, 1.2429-1.2445, 1.2520, 1.2605-1.2620, 1.2693 lines can also be sources of signals. Signals can be "bounces" and "breakouts" of these levels and lines. It is recommended to set the Stop Loss level to break-even when the price moves in the right direction by 20 pips. The Ichimoku indicator lines can move during the day, which should be taken into account when determining trading signals. The illustration also includes support and resistance levels that can be used to lock in profits from trades.
On Friday, there are no interesting reports or events lined up in the UK. The US will release reports on Non-Farm Payrolls and unemployment. These are essentially the only reports for today, and they are the main focus on this week's agenda. Therefore, you should focus on them. The market reaction can be strong and unpredictable.
Description of the chart:
Support and resistance levels are thick red lines near which the trend may end. They do not provide trading signals;
The Kijun-sen and Senkou Span B lines are the lines of the Ichimoku indicator, plotted to the 1H timeframe from the 4H one. They provide trading signals;
Extreme levels are thin red lines from which the price bounced earlier. They provide trading signals;
Yellow lines are trend lines, trend channels, and any other technical patterns;
Indicator 1 on the COT charts is the net position size for each category of traders;
Indicator 2 on the COT charts is the net position size for the Non-commercial group.