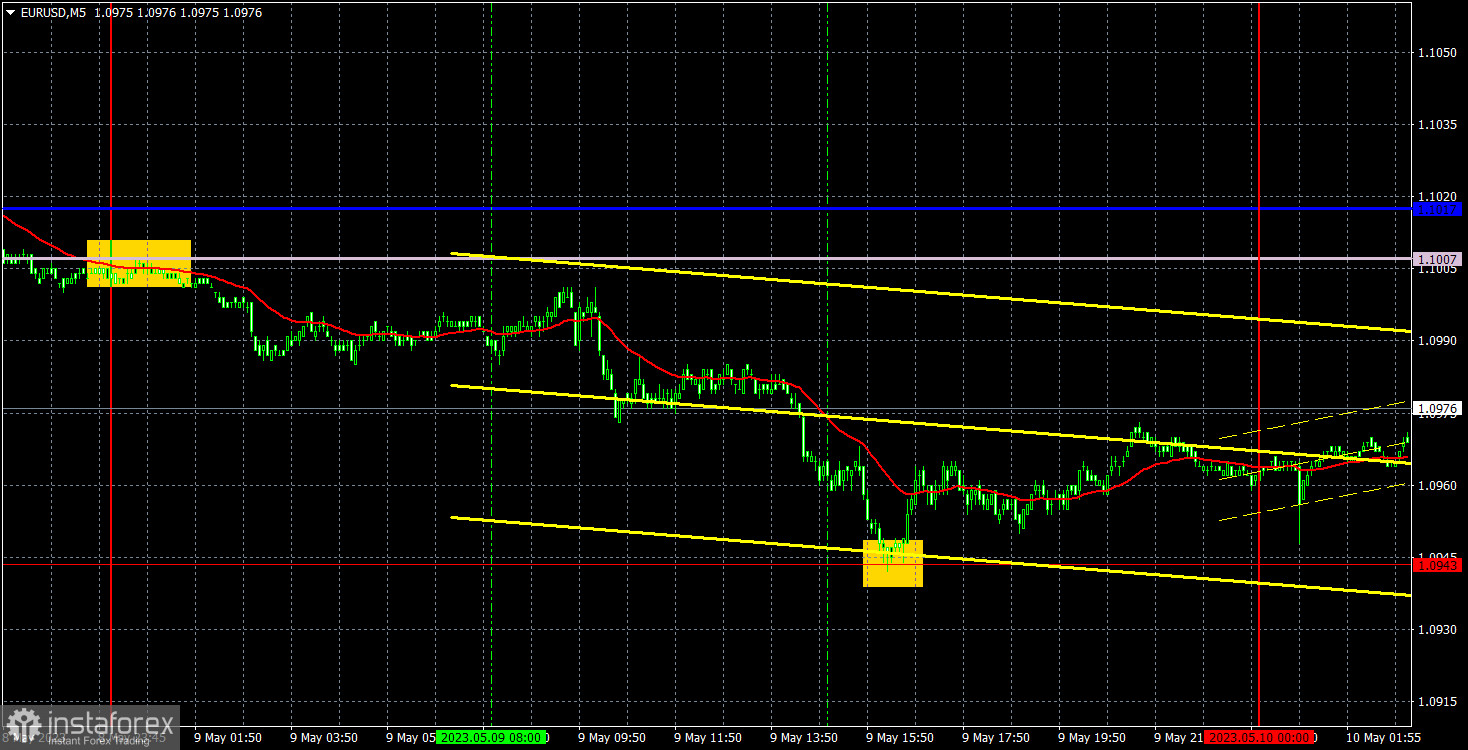
5M chart of EUR/USD
On Tuesday, the EUR/USD pair continued its weak downward movement and ended the day around 1.0943. This level is the conditional lower limit of the sideways channel, in which the pair has been for several weeks, and is also the last local low. Thus, until the price overcomes this level, there is no need to expect a strong decline. The euro's decline should not be misleading either. At the moment, it has lost a meager number of points compared to the growth of recent months.
There were no macro data or fundamental events yesterday. But the downward movement is just a movement within the sideways channel, which doesn't require any basis. The pair does not only move when there is a foundation or macroeconomics. Therefore, the uptrend may still be preserved, and breaking through the next trend line on the hourly chart means absolutely nothing.
There were few trading signals yesterday. At night, the price finally overcame the Ichimoku indicator lines, Senkou Span B and Kijun-sen, and by the time the European trading session opened, it moved away from the signal formation point by 5-6 points. Therefore, it was possible to open a short position. Subsequently, the price dropped to 1.0943, and it bounced from this area, forming a buy signal. So, short positions should have been closed with a profit of about 40 points and longs opened. The long position allowed to earn another 10 points of profit, which should have been closed manually.
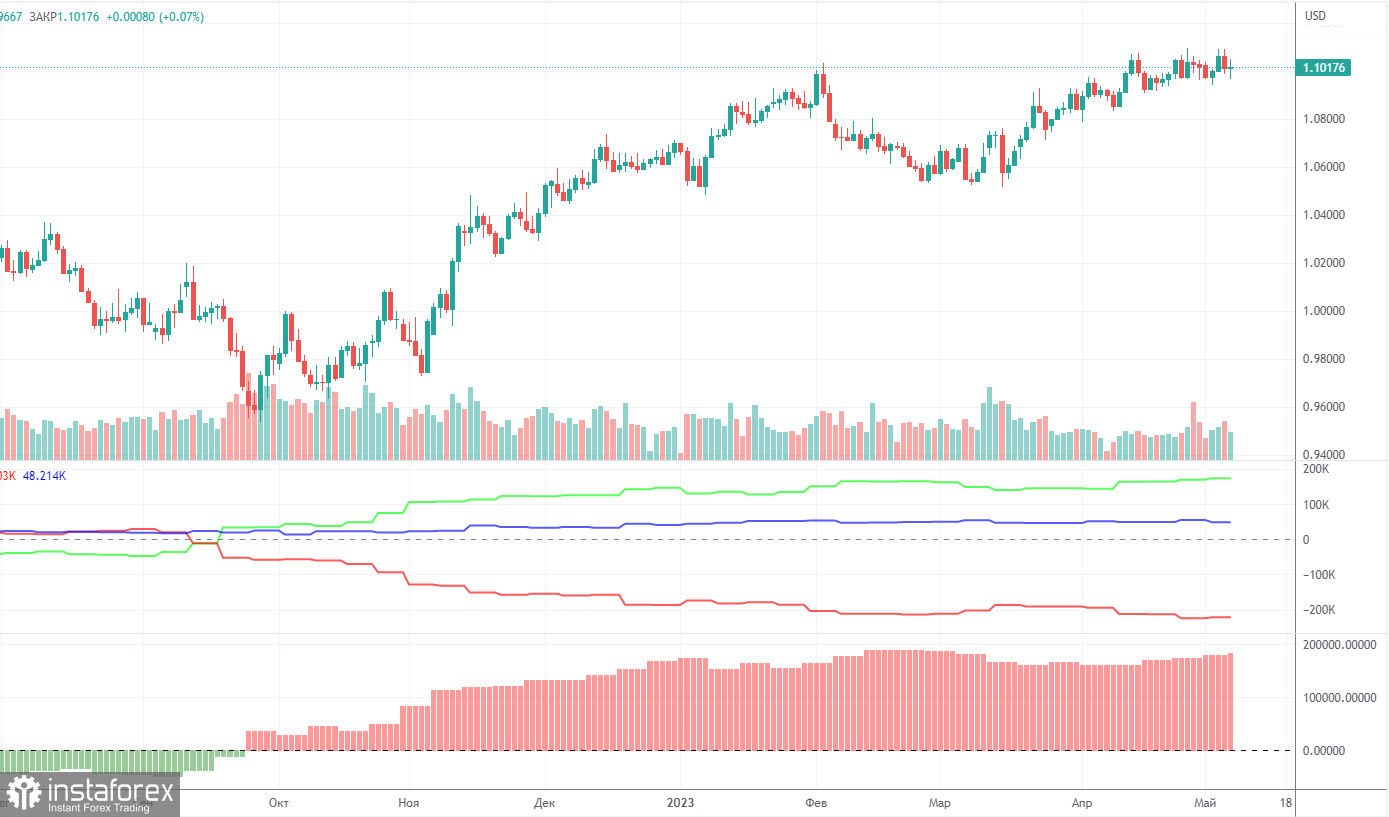
COT report:
On Friday, a new COT report was released for May 2. In the past 8-9 months, the COT report data has been completely in line with market developments. The illustration above clearly shows that the net position of large market players (second indicator) began to grow in September 2022. Around the same time, the European currency also began to appreciate. Currently, the net position of the non-commercial group of traders remains bullish and so does the position of the European currency, which is hesitating to develop a proper downward correction.
We have previously drawn your attention to the fact that a relatively high net position value suggests a possible end of the uptrend. This is signaled by the first indicator where the red and green lines have moved significantly away from each other, which often precedes the end of a trend. The European currency attempted to start a decline, but we only saw a simple pullback. During the last reporting week, the number of Buy contracts in the non-commercial group of traders increased by 3,300, while the number of Sell contracts decreased by 700. Accordingly, the net position grew again by 4,000 contracts. The number of BUY contracts is higher than the number of SELL contracts among non-commercial traders by 174,000, which is very significant. The difference is almost threefold. A correction is still overdue, so even without COT reports, it is clear that the pair should start falling. However, we still only see an upward movement.
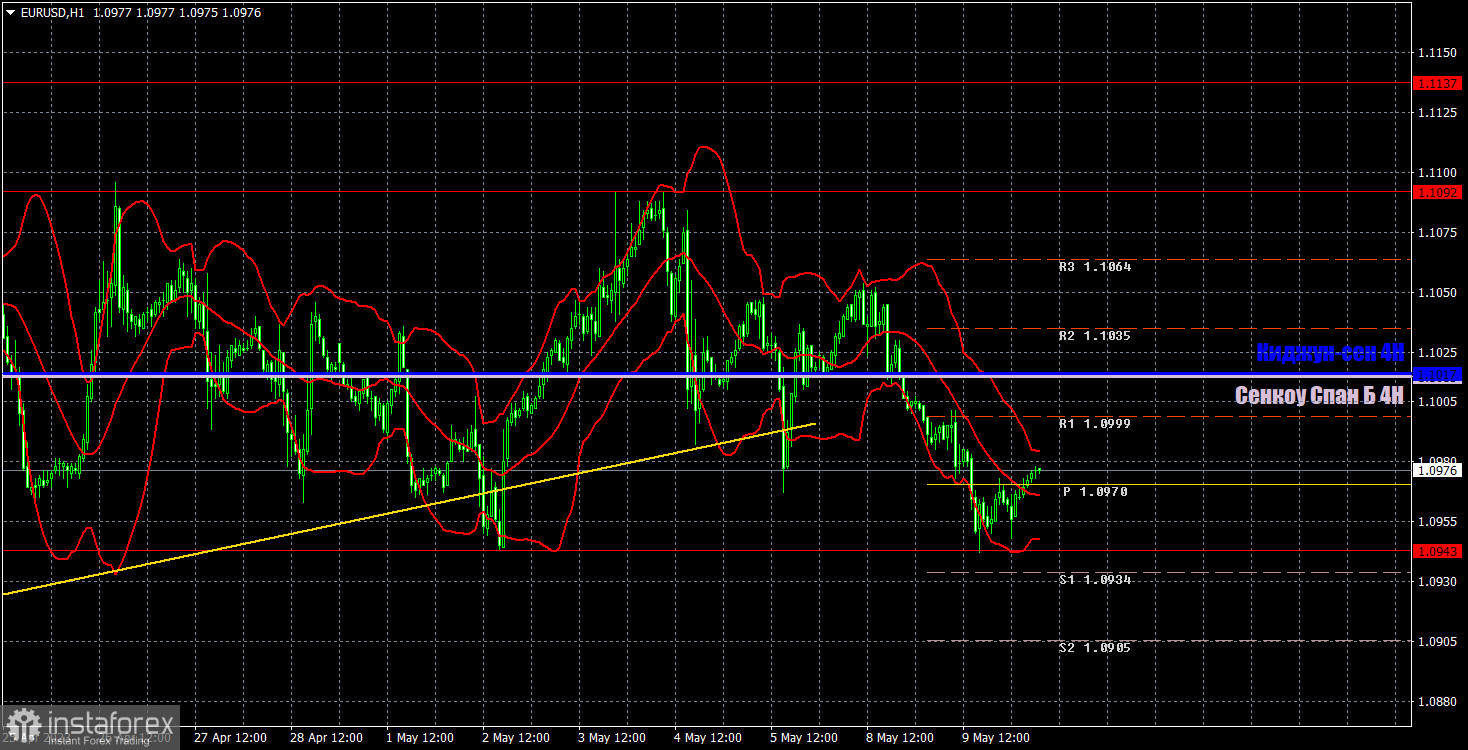
1H chart of EUR/USD
On the 1-hour chart, the pair continues to exhibit strange and incomprehensible movement. The price continues to move in a sideways channel. The lines of the Ichimoku indicator are weak in a flat. The euro is still trading too high. It is overbought and unable to start a correction. We continue to advocate for the pair's decline.
On Wednesday, important levels are seen at 1.0762, 1.0806, 1.0868, 1.0943, 1.1092, 1.1137-1.1185, 1.1234, 1.1274, as well as the Senkou Span B (1.1017) and Kijun-sen (1.1017) lines. Ichimoku indicator lines can move intraday, which should be taken into account when determining trading signals. There are also support and resistance although no signals are made near these levels. They could be made when the price either breaks or rebounds from these extreme levels. Do not forget to place Stop Loss at the breakeven point when the price goes by 15 pips in the right direction. In case of a false breakout, it could save you from possible losses.
On May 10, no important events or reports are planned in the European Union. On the other hand, the US will release its inflation report for April. The market will focus on this report. If the result turns out to be neutral, the market reaction may not follow at all, but we still expect some sort of movement.
Indicators on charts:
Resistance/support - thick red lines, near which the trend may stop. They do not make trading signals.
Kijun-sen and Senkou Span B are the Ichimoku indicator lines moved to the hourly timeframe from the 4-hour timeframe. They are also strong lines.
Extreme levels are thin red lines, from which the price used to bounce earlier. They can produce trading signals.
Yellow lines are trend lines, trend channels, and any other technical patterns.
Indicator 1 on the COT chart is the size of the net position of each trader category.
Indicator 2 on the COT chart is the size of the net position for the Non-commercial group of traders.