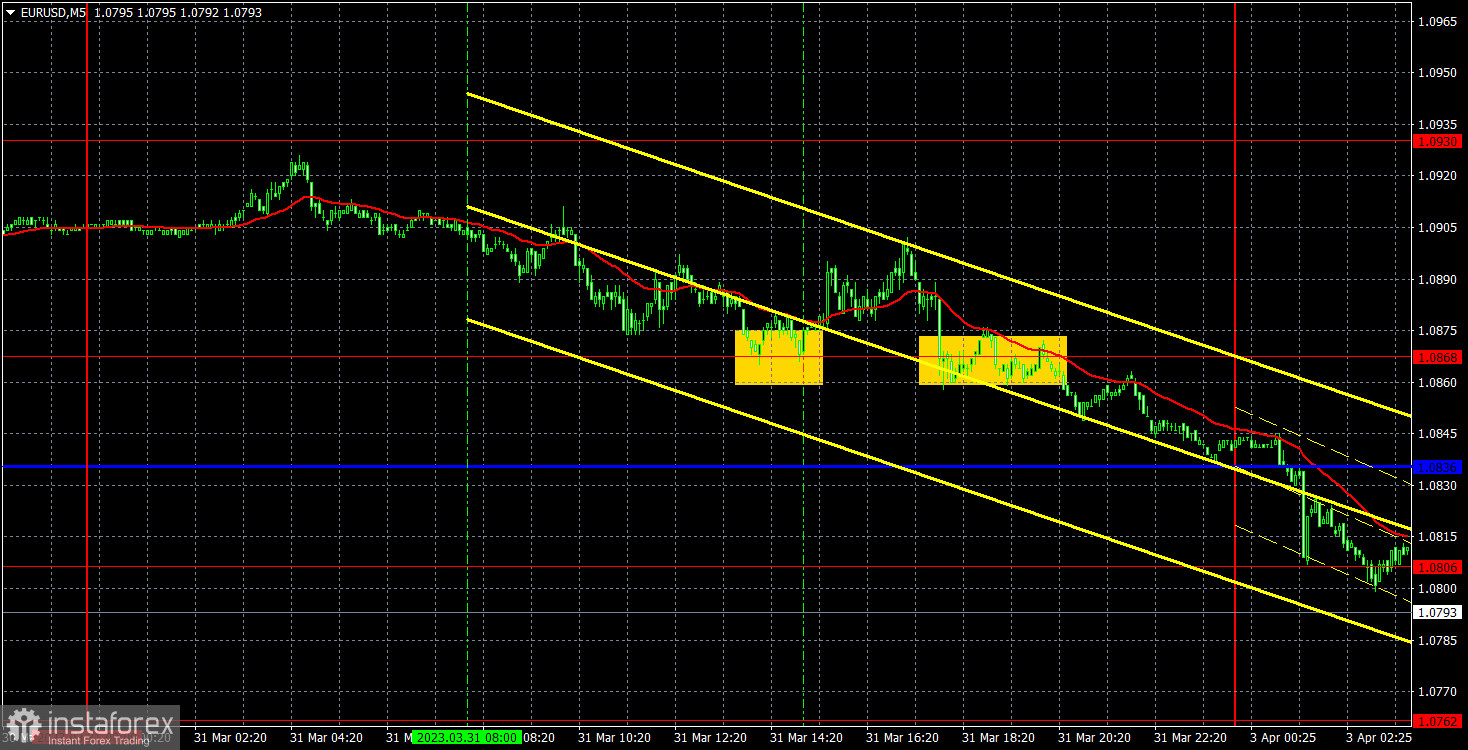
5M chart of EUR/USD
On Friday, EUR/USD started to trade lower, which we have been waiting for a long time. We can only hope that it will not end today or tomorrow, as it did last time. In our fundamental articles, we spoke about why the pair should sharply fall in the near future. I still don't see any good reasons why the euro should rise further. Especially after Friday's EU inflation report. While core inflation has risen, headline inflation has slowed down a lot, which cannot be ignored. Therefore, in summary, I think we saw a perfectly logical move on Friday, which should only gain momentum. The pair has crossed the new uptrend line, which gives us a strong technical sell signal. On the 24-hour view, the pair could already make a reversal near the upper limit of the horizontal channel. So far, most of the factors indicate a decline. The first target is the Senkou Span B line.
There were few trading signals on Friday. At the end of the European session, the pair reached 1.0868 and rebounded from it. It went up about 20 points, so a Stop Loss should have been set to Breakeven, which was used to close the position. Then there was a sell signal near the same level, but it was formed too late and shouldn't be used anymore.
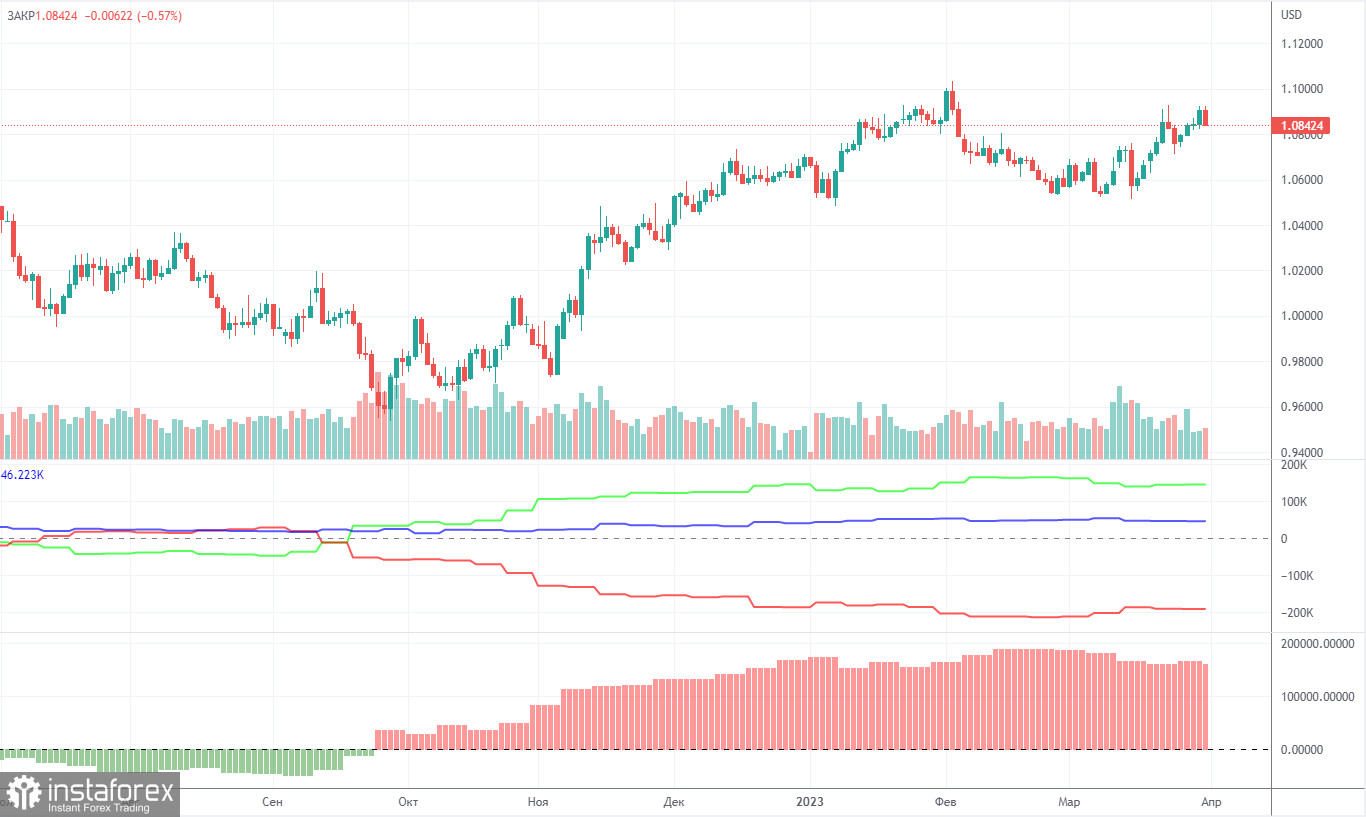
COT report:
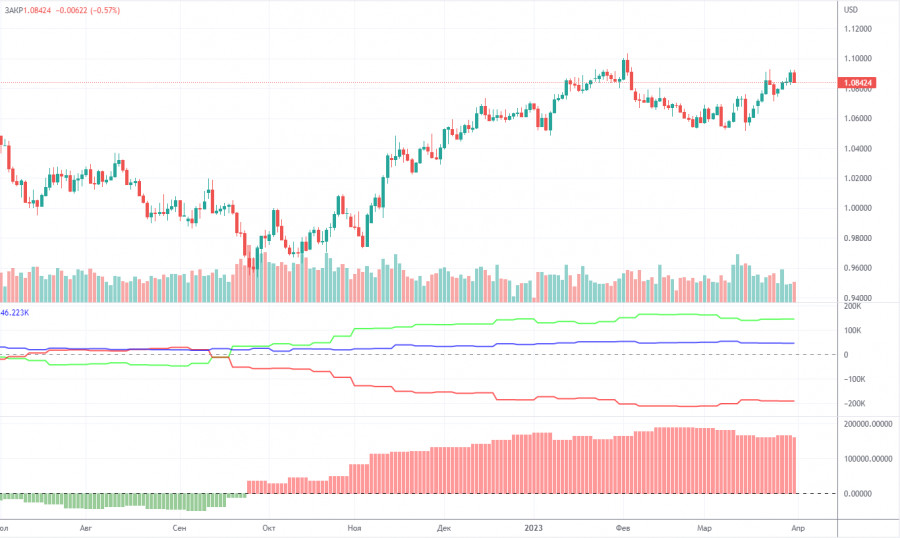
On Friday, the new COT report for March 28 was released. The Commodity Futures Trading Commission has caught up with the lost time and has now released reports exactly on time. In the last few months, the picture was completely consistent with what was happening in the market. On the chart above, we see that the net non-commercial position of large traders (second indicator) has risen since September 2022. At about the same time, the euro started to rise. The net non-commercial position was bullish while the euro could not start a full-fledged bearish correction. I have already drawn your attention to the fact that a fairly high value of the "net position" allows us to expect the uptrend to stop shortly. Such a signal comes from the first indicator, with the green line and the red line being far apart, which is usually a sign of the end of a trend. The euro has already started to fall, but so far it's just a pullback. According to the latest report, non-commercial traders increased 7,100 long positions, while the number of short ones increased by 6,900. Consequently, the net position practically remained unchanged. The number of long positions exceeds that of short ones by 145,000. In any case, a correction has been looming for a long time. Therefore, even without reports, it is clear that the downtrend will continue.
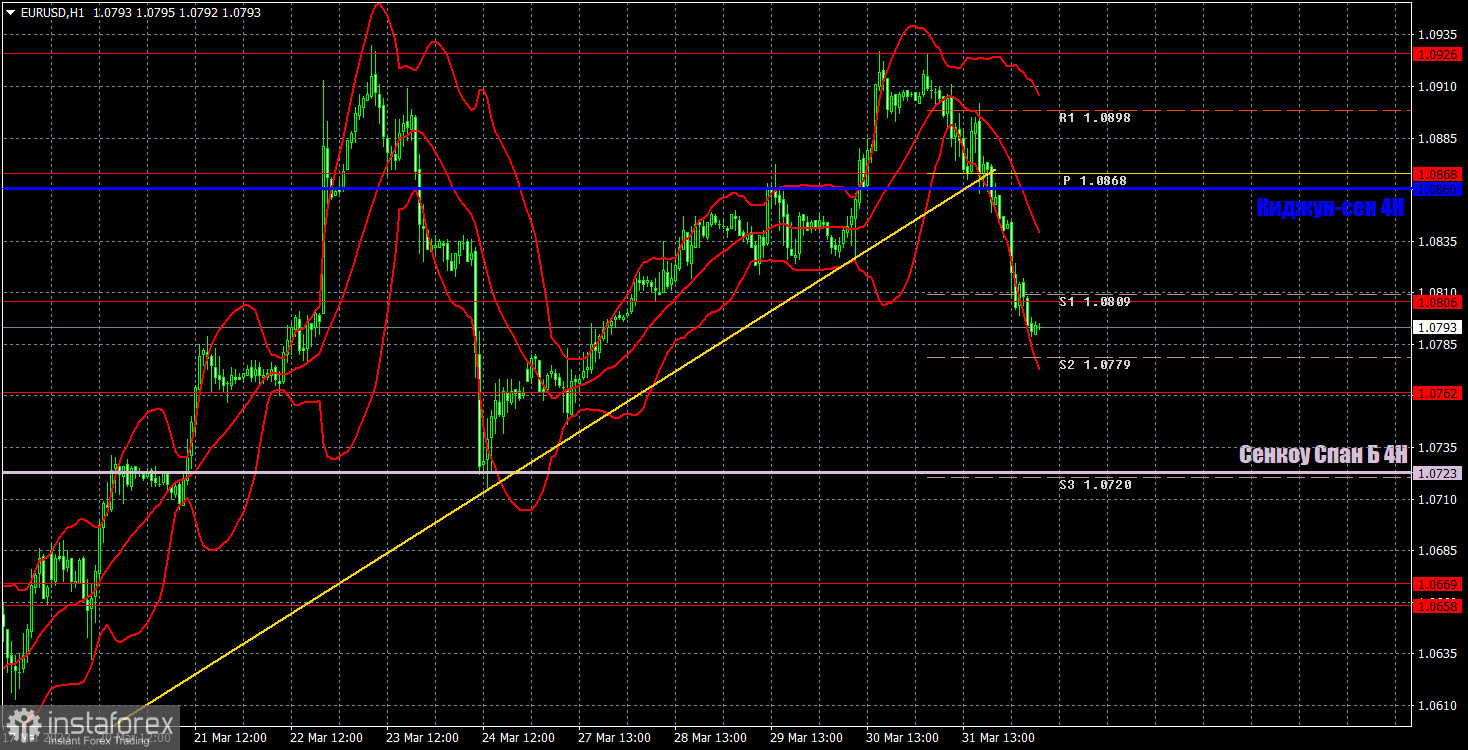
1H chart of EUR/USD
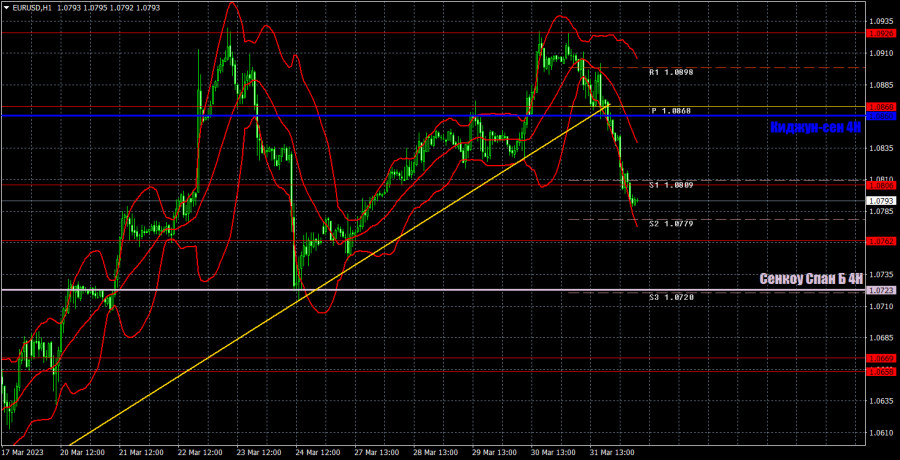
On the one-hour chart, EUR/USD finally started falling, which could be the very beginning of a new downtrend of 400-500 pips. The pair overcame the critical line, the trend line and rebounded twice from 1.0926. This is enough to expect a sharp decline. The fundamental and macroeconomic backgrounds aren't that highly important right now. The fact that the pair is flat on the 24-hour chart does. On Monday, important levels are seen at 1.0537, 1.0581, 1.0658-1.0669, 1.0762, 1.0806, 1.0868, 1.0926, 1.1033, 1.1137-1.1185 as well as the Senkou Span B (1.0723) and Kijun Sen (1.0860) lines. Ichimoku indicator lines can move intraday, which should be taken into account when determining trading signals. There are also support and resistance although no signals are made near these levels. They could be made when the price either breaks or rebounds from these extreme levels. Do not forget to place Stop Loss at the breakeven point when the price goes by 15 pips in the right direction. In case of a false breakout, it could save you from possible losses. On April 3, the EU will release its PMI for March and the US will release the ISM index, which is considered more important. The movements might be stronger in the afternoon, provided the actual value deviates from forecasts, but on the whole, volatility has been much lower lately.
Indicators on charts:
Resistance/support - thick red lines, near which the trend may stop. They do not make trading signals.
Kijun-sen and Senkou Span B are the Ichimoku indicator lines moved to the hourly timeframe from the 4-hour timeframe. They are also strong lines.
Extreme levels are thin red lines, from which the price used to bounce earlier. They can produce trading signals.
Yellow lines are trend lines, trend channels, and any other technical patterns.
Indicator 1 on the COT chart is the size of the net position of each trader category.
Indicator 2 on the COT chart is the size of the net position for the Non-commercial group of traders.