Analyzing Thursday's trades:
EUR/USD on 30M chart
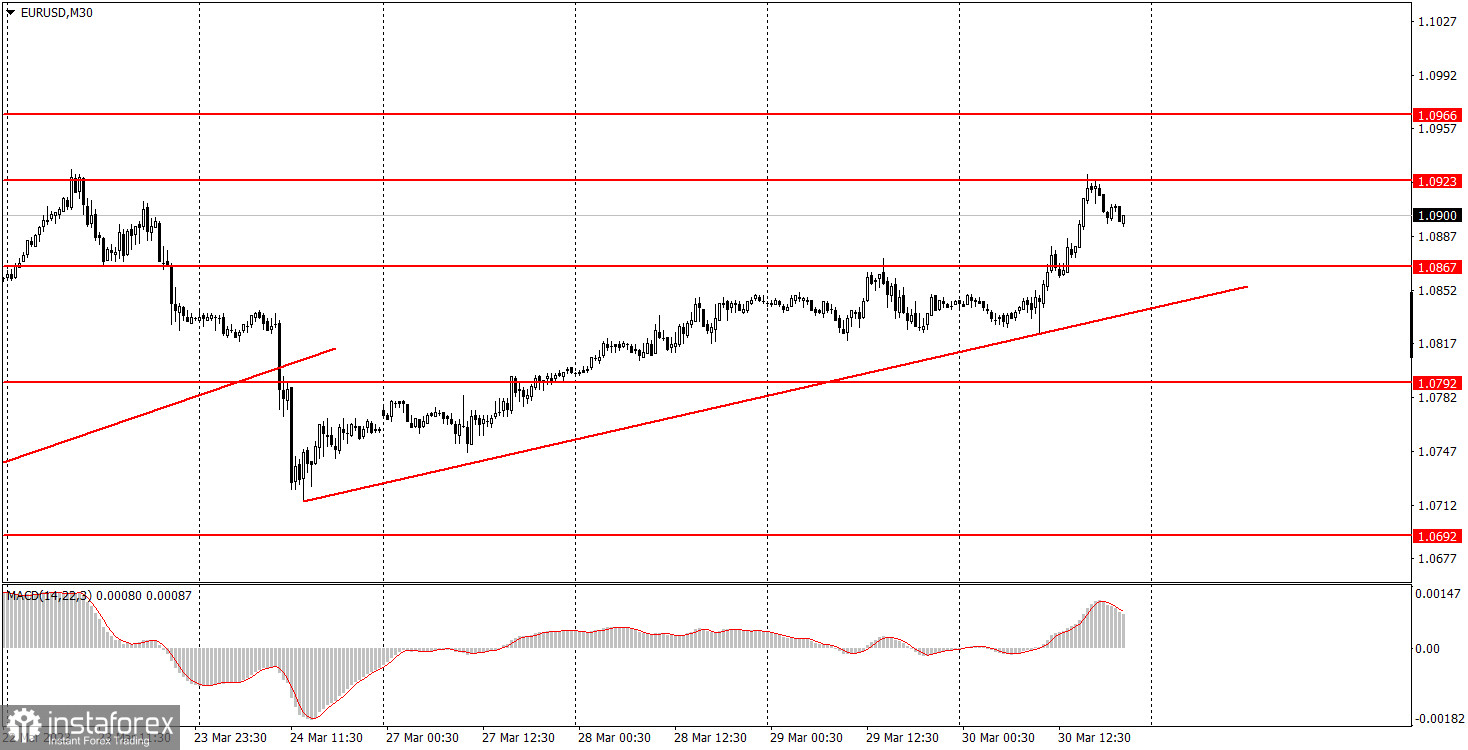
On Thursday, EUR/USD stretched its upward movement, which isn't surprising anymore. A new uptrend line was formed, which appeared almost immediately after the pair overcame the previous one. We didn't even see a tangible bearish correction before the upward movement resumed. It wouldn't be the first time, though. At least, there was a macroeconomic background this time, which could theoretically provoke the pair's growth. We still don't know why the euro rose during the first three days of the week. In the long term, the euro has some reasons for growth, but I still believe that the previous growth was unreasonable. Germany released its inflation report for March, which showed a sharp decline. And it was supposed to provoke the euro's fall, because it reduces the probability of the European Central Bank rate hike by 0.5% in May. But the euro did not fall here either. The market reaction was simply illogical.
EUR/USD on 5M chart
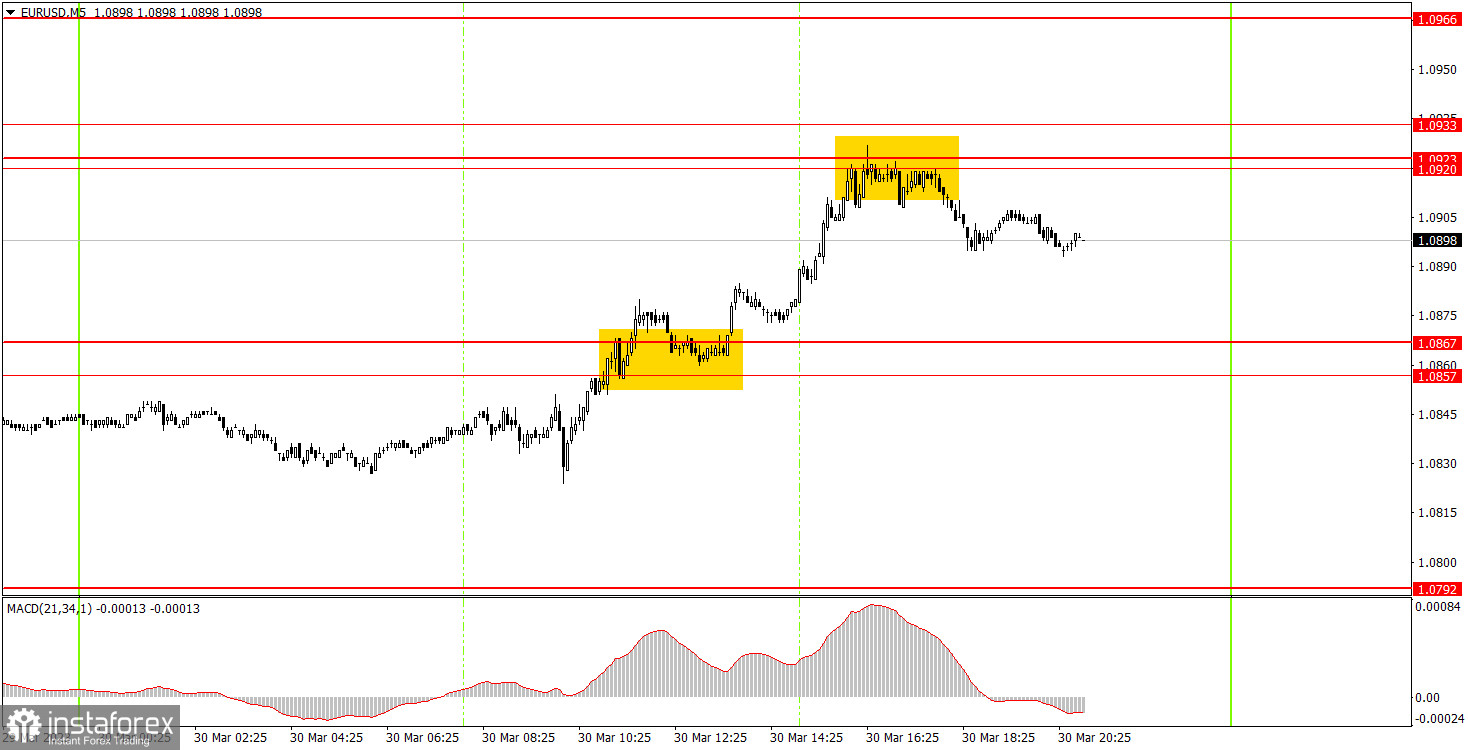
There were two signals on the 5-minute chart and volatility was 103 pips, which is something. The first buy signal, breaking through the area of 1.0857-1.0867, made it possible for beginners to open a long position. Later, the pair reached the area of 1.0920-1.0933, from which it bounced and gained nearly 35 pips. Traders could also open a short position on the rebound from 1.0920, which would give about 10 pips more. Thus, the total profit was about 45 pips, which is not bad at all. Beginners could make sure that it's quite easy and profitable to trade with a trend and volatile movement.
Trading tips on Friday:
On the 30-minute chart, the pair formed a new uptrend and has been rising for four straight days. Moreover, there was almost no fundamental or macroeconomic background, and the pair has grown very strongly in recent weeks. Now we can expect the euro to fall once the pair overcomes the new trend line. And we shouldn't count on the macroeconomic background for help, as the pair should fall on its basis. On the 5-minute chart, it is recommended to trade at the levels 1.0587-1.0607, 1.0692, 1.0737, 1.0792, 1.0857-1.0867, 1.0920-1.0933, 1.0966, 1.0989, 1.1038, 1.1070. As soon as the price passes 15 pips in the right direction, you should set a Stop Loss to breakeven. On Friday, the European Union will release its March inflation report and ECB President Christine Lagarde will also give a speech. One would assume that the pair might fall after those events, but on Thursday, the euro showed that it could easily rise in any environment.
Basic rules of the trading system:
1) The strength of the signal is determined by the time it took the signal to form (a rebound or a breakout of the level). The quicker it is formed, the stronger the signal is.
2) If two or more positions were opened near a certain level based on a false signal (which did not trigger a Take Profit or test the nearest target level), then all subsequent signals at this level should be ignored.
3) When trading flat, a pair can form multiple false signals or not form them at all. In any case, it is better to stop trading at the first sign of a flat movement.
4) Trades should be opened in the period between the start of the European session and the middle of the US trading hours when all positions must be closed manually.
5) You can trade using signals from the MACD indicator on the 30-minute time frame only amid strong volatility and a clear trend that should be confirmed by a trendline or a trend channel.
6) If two levels are located too close to each other (from 5 to 15 pips), they should be considered support and resistance levels.
On the chart:
Support and Resistance levels are the levels that serve as targets when buying or selling the pair. You can place Take Profit near these levels.
Red lines are channels or trend lines that display the current trend and show in which direction it is better to trade now.
The MACD indicator (14, 22, and 3) consists of a histogram and a signal line. When they cross, this is a signal to enter the market. It is recommended to use this indicator in combination with trend patterns (channels and trendlines).
Important announcements and economic reports that can be found on the economic calendar can seriously influence the trajectory of a currency pair. Therefore, at the time of their release, we recommend trading as carefully as possible or exiting the market in order to avoid sharp price fluctuations.
Beginners on Forex should remember that not every single trade has to be profitable. The development of a clear strategy and money management is the key to success in trading over a long period of time.