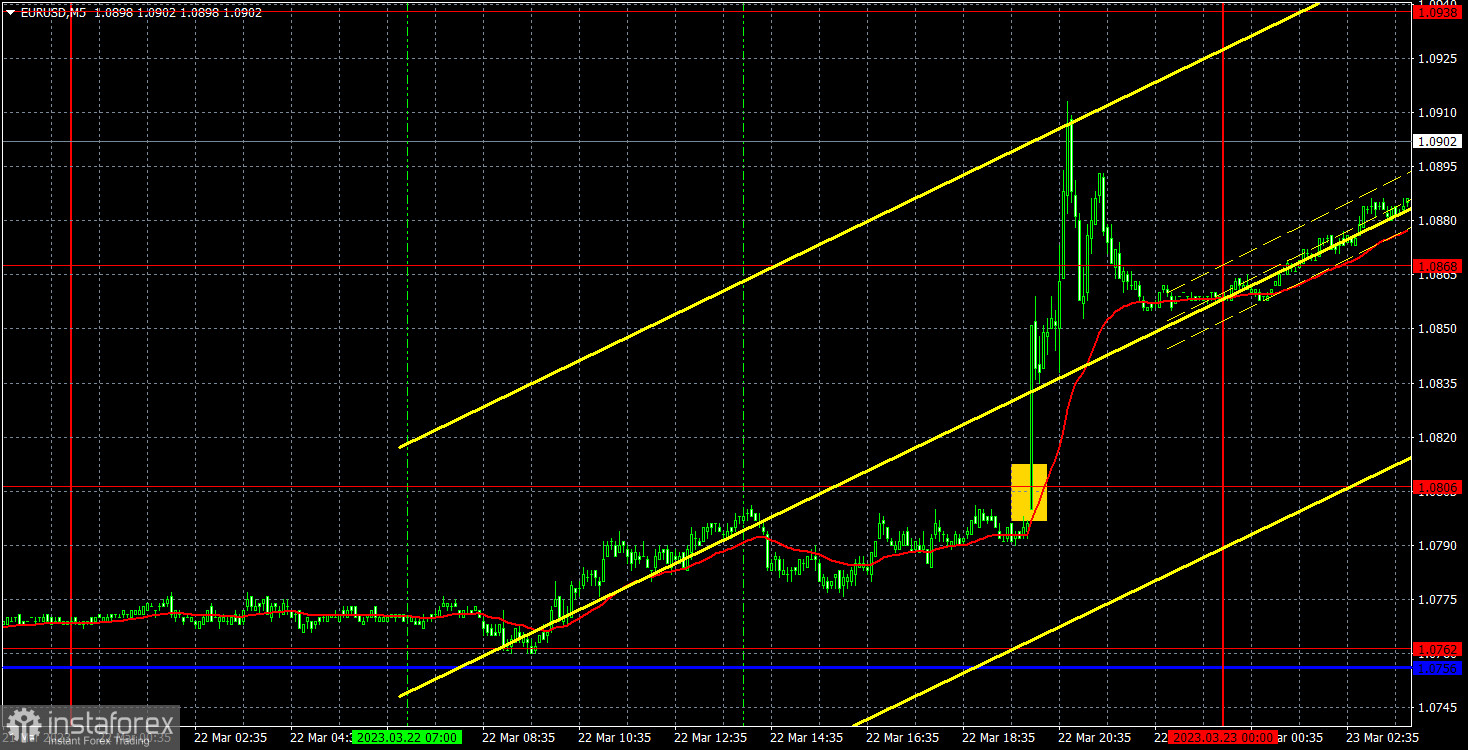
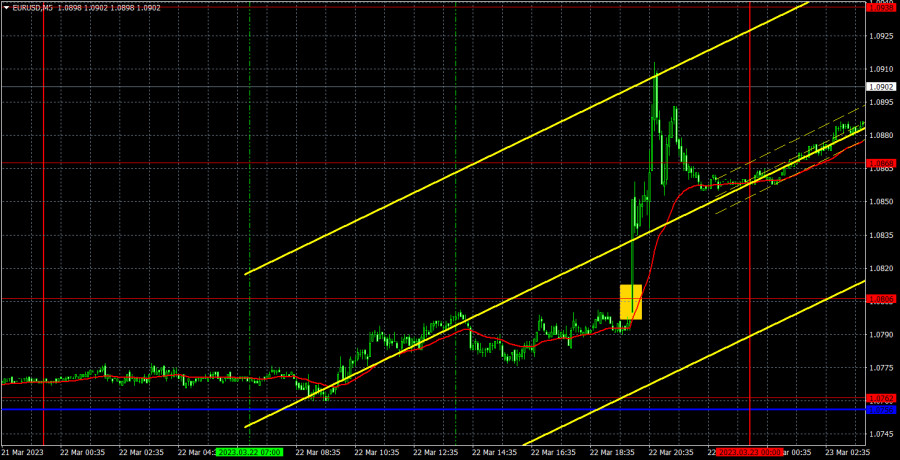
5M chart of EUR/USD
On Wednesday, EUR/USD traded higher again. Last night the Federal Reserve was summing up the results of its second meeting this year and the market was very worried about the central bank's decision. Over the last couple of weeks, the rate expectations have been constantly changing. Many experts assumed that the Fed would take a pause or lower the rate amid the banking crisis. And as a result, the Fed raised the rate "as planned" - by 0.25%. Market reaction to the meeting was quite predictable. Initially, the demand for the US currency fell, then it grew and now it is still trading higher. I think the market still undervalues both the dollar and the Fed, and overvalues the European Central Bank and the euro. As the single currency rises for the sixth straight day, you can't help but wonder what is pushing the pair up. The Fed has tightened its monetary policy, which is supposed to provoke the dollar's growth. Especially considering the fact that it had been falling five days before that too.
It makes no sense to analyze Wednesday's trading signals, because there were none. Until the evening, the pair was traded in a very narrow range, and it only surged after the announcement of the meeting's results. Thus, the first buy signal was formed when the pair passed 1.0806, but there were no reasons to work it out. And traders did not have the opportunity to open a long position in time.
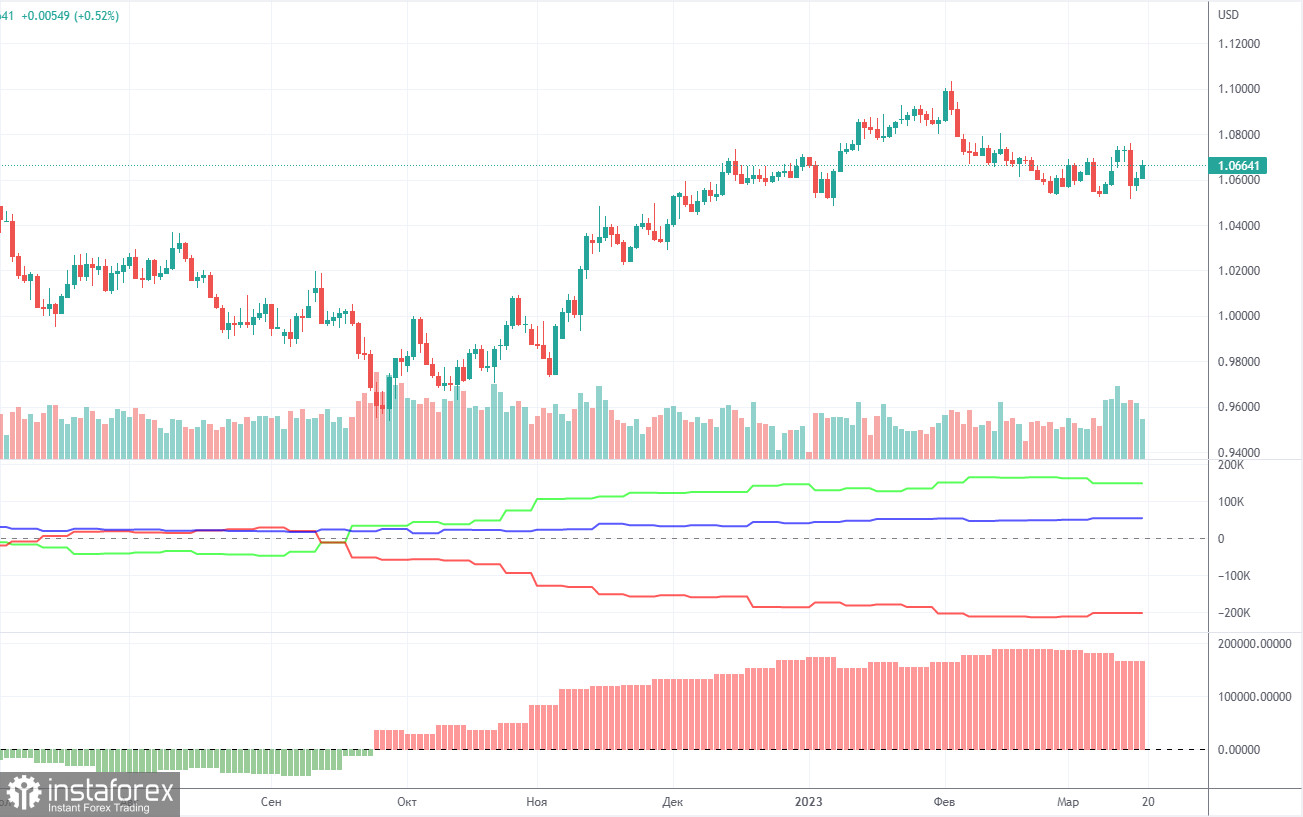
COT report:
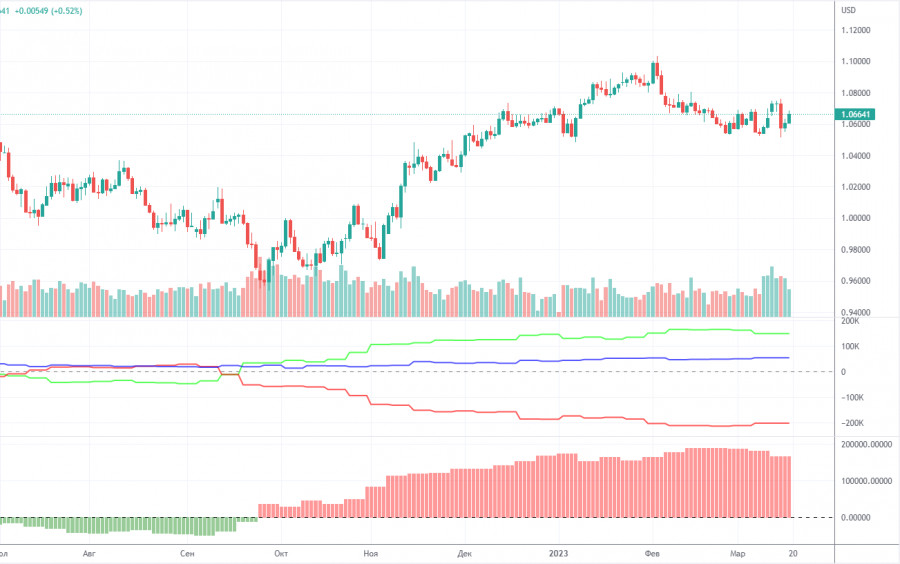
On Friday, the new COT report for March 7 was released. The Commodity Futures Trading Commission is slowly catching up with the lost time and publishes reports that have a frequency of two weeks. At this rate, in a couple of weeks we will get the actual data again. So far, we can say that in the last few months, the overall picture has been corresponding to the market situation. On the chart above, we see that the net non-commercial position of large traders (second indicator) has risen since September 2022. At about the same time, the euro started to rise. The net non-commercial position is bullish and only started to fall during the last couple of weeks, which coincides with the euro's decline. I have already drawn your attention to the fact that a fairly high value of the "net position" allows us to expect the uptrend to stop shortly. Such a signal comes from the first indicator, with the green line and the red line being far apart, which is usually a sign of the end of a trend. The euro has already started to fall, but we don't know if it's just a bearish correction or a new downtrend. According to the latest report, non-commercial traders closed 6,900 long positions, while the number of short ones increased by 6,900. Consequently, the net position fell by 13,800. The number of long positions exceeds that of short ones by 148,000. In any case, a correction has been looming for a long time. Therefore, even without reports, it is clear that the downtrend will continue.
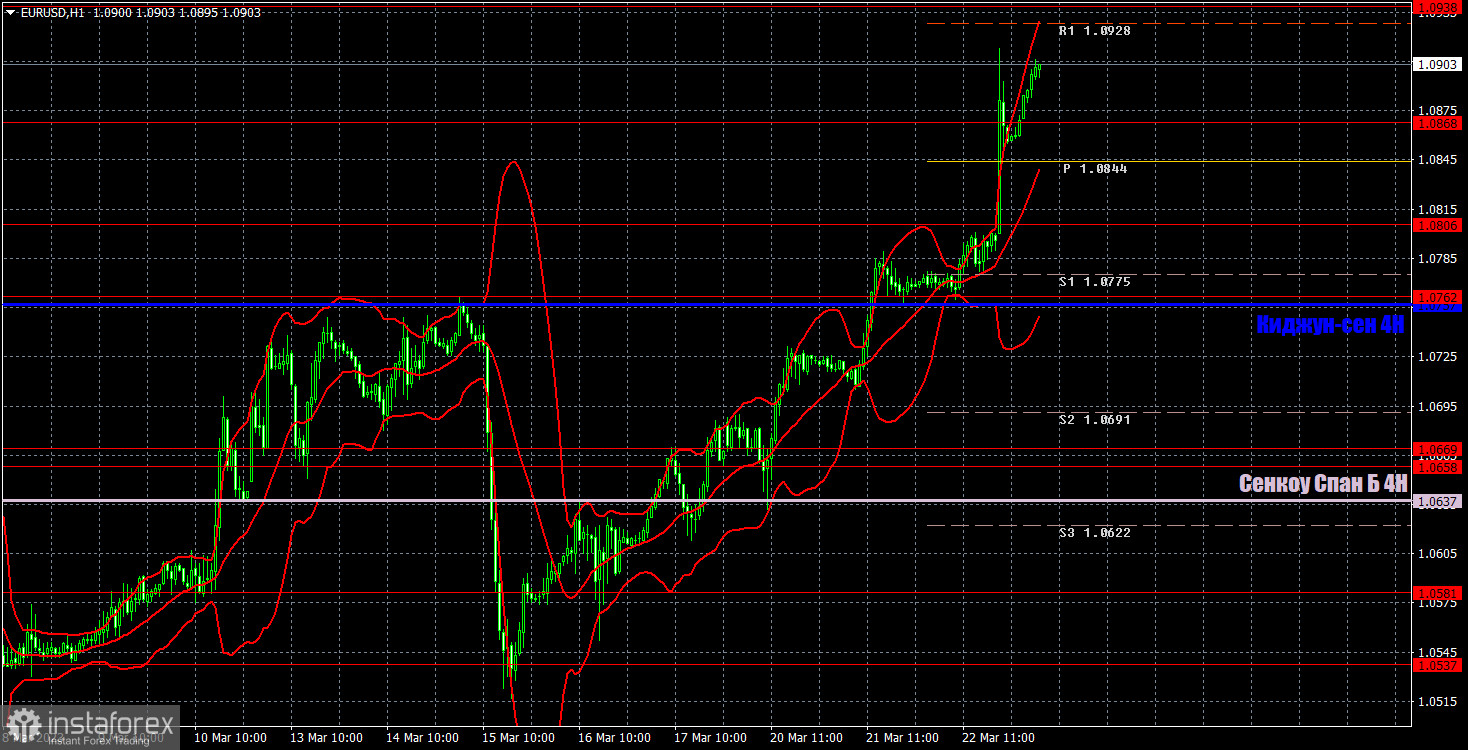
1H chart of EUR/USD
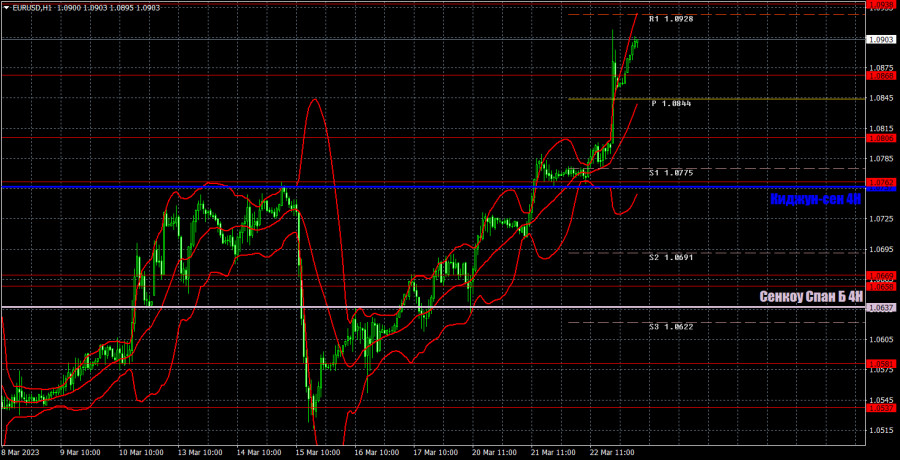
On the one-hour chart, EUR/USD continues to trade in a "swing" mode, but at the same time, it has been growing for the sixth straight day, which looks quite strange. Now we can talk about a new uptrend, though we still do not see enough reasons for such a movement. Even on the 1H chart, we can see how fast and sharply the pair is growing. Such a strong movement cannot be prolonged a priori. On Thursday, important levels are seen at 1.0581, 1.0658-1.0669, 1.0762, 1.0806, 1.0868, 1.0938, 1.1033, 1.1137-1.1185, and also Senkou Span B lines (1.0637) and Kijun Sen (1.0757) lines. Ichimoku indicator lines can move intraday, which should be taken into account when determining trading signals. There are also support and resistance although no signals are made near these levels. They could be made when the price either breaks or rebounds from these extreme levels. Do not forget to place Stop Loss at the breakeven point when the price goes by 15 pips in the right direction. In case of a false breakout, it could save you from possible losses. On March 23, no important events are scheduled in the European Union, while there will only be secondary reports in the US. I think that the market will continue to work on the results of the Fed meeting. In fact, it has already started to do so, judging by the night trading, which turned out to be quite active.
Indicators on charts:
Resistance/support - thick red lines, near which the trend may stop. They do not make trading signals.
Kijun-sen and Senkou Span B are the Ichimoku indicator lines moved to the hourly timeframe from the 4-hour timeframe. They are also strong lines.
Extreme levels are thin red lines, from which the price used to bounce earlier. They can produce trading signals.
Yellow lines are trend lines, trend channels, and any other technical patterns.
Indicator 1 on the COT chart is the size of the net position of each trader category.
Indicator 2 on the COT chart is the size of the net position for the Non-commercial group of traders.