Review & Forecast :
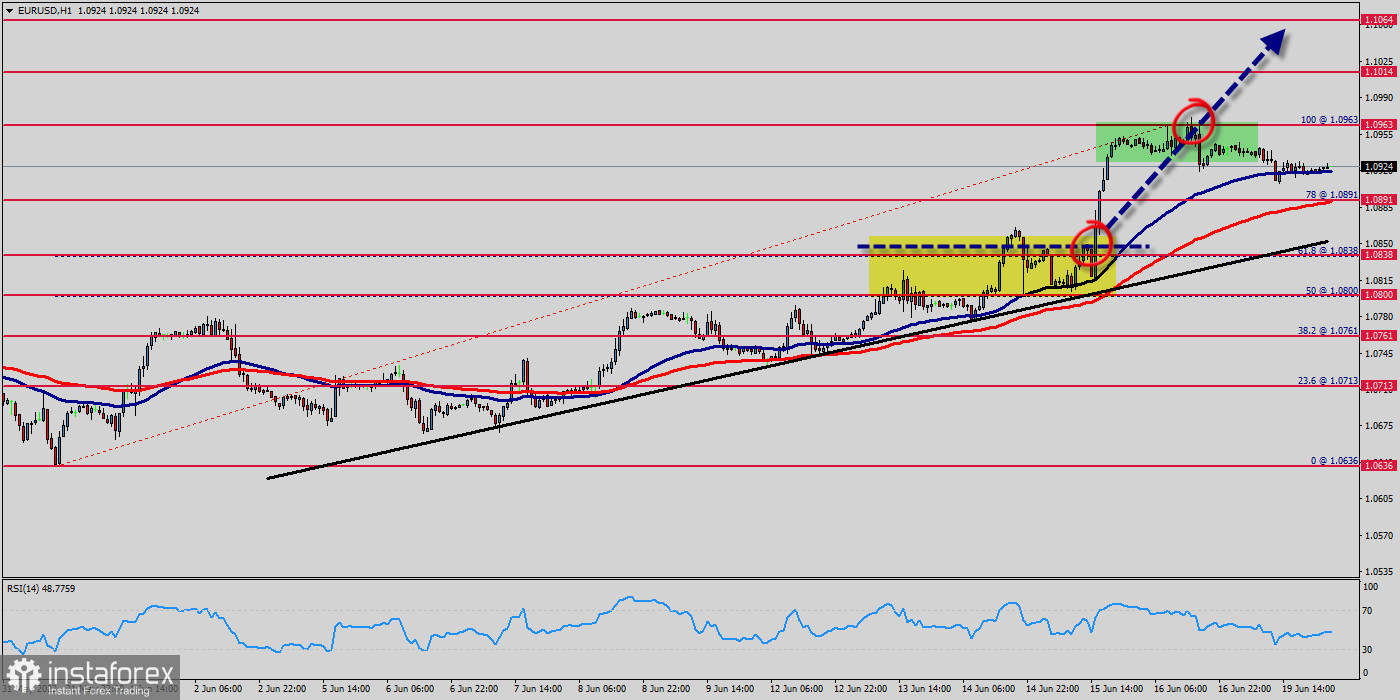
The weekly pivot point placed at the price of 1.0838. The EUR/USD pair will continue rising from the level of 1.0712 today. So, the support is found at the level of 1.0712, which represents the 50% Fibonacci retracement level in the H1 time frame. Since the trend is above the 50% Fibonacci level, the market is still in an uptrend. With that in mind, is there more room for the Euro to rally?
On the daily chart, the EUR/USD pairis showing signs of an increasingly bullish technical bias. Prices have broken under the rising trendline from September. Meanwhile, a bullish between the 50- and 100-day Simple Moving Averages is present (SMA). Currently, prices are idling just under the 1.0700 and 1.0715 inflection zone. Key support below is the 50% Fibonacci retracement level at 1.0712. In the event of a turn higher, the moving averages may hold as key resistance, maintaining the upside focus.
The EUR/USD pair has faced strong support at the level of 1.0712 because resistance became support. So, the strong resistance has been already faced at the level of 1.0788 and the pair is likely to try to approach it in order to test it again. The level of 1.0712 represents a weekly pivot point for that it is acting as minor support this week. Furthermore, the EUR/USD pair is continuing to trade in a bullish trend from the new support level of 1.0712.
Currently, the price is in a bullish channel. According to the previous events, we expect the EUR/USD pair to move between 1.0712 and 1.0814. Also, it should be noticed that the double top is set at 1.0788. Additionally, the RSI is still signaling that the trend is upward as it remains strong above the moving average (100).
This suggests the pair will probably go up in coming hours. Accordingly, the market is likely to show signs of a bullish trend. In other words, buy orders are recommended above 1.0712 with the first target at the level of 1.0788 . If the trend is be able to break the double top at the level of 1.0788, then the market will continue rising towards the weekly resistance 1 at 1.0814. However, the price spot of 1.0814 remains a significant resistance zone. Thus, the trend will probably be rebounded again from the double top as long as the level of 1.0814 is not breached. The market is still in an uptrend. We still prefer the bullish scenario.
The EUR/USD pair extended its rally and reached its highest level in a month above 1.0920. The US Dollar tumbled amid increased risk appetite and a decline in Treasury yields. The EURUSD pair continues to rise to test the key resistance 1.0920 now, which urges caution from the upcoming trading, as continuing the rise and breaking this level will stop the recently suggested bearish trend and push the price to return to the main bullish track again.
On the daily chart, the EUR/USD pairis showing signs of an increasingly bullish technical bias. Prices have broken under the rising trendline from September. Meanwhile, a bullish between the 50- and 100-day Simple Moving Averages is present (SMA).
Currently, prices are idling just under the 1.0700 and 1.0715 inflection zone. Key support below is the 50% Fibonacci retracement level at 1.0712. In the event of a turn higher, the moving averages may hold as key resistance, maintaining the upside focus. The EUR/USD pair has faced strong support at the level of 1.0712 because resistance became support. So, the strong resistance has been already faced at the level of 1.0788 and the pair is likely to try to approach it in order to test it again. The level of 1.0712 represents a weekly pivot point for that it is acting as minor support this week.
The EUR/USD pair is continuing to trade in a bullish trend from the new support level of 1.0712. Currently, the price is in a bullish channel. According to the previous events, we expect the EUR/USD pair to move between 1.0712 and 1.0814. Also, it should be noticed that the double top is set at 1.0788. Additionally, the RSI is still signaling that the trend is upward as it remains strong above the moving average (100). This suggests the pair will probably go up in coming hours.
Accordingly, the market is likely to show signs of a bullish trend. In other words, buy orders are recommended above 1.0712 with the first target at the level of 1.0788 . If the trend is be able to break the double top at the level of 1.0788, then the market will continue rising towards the weekly resistance 1 at 1.0814.
However, the price spot of 1.0814 remains a significant resistance zone. Thus, the trend will probably be rebounded again from the double top as long as the level of 1.0814 is not breached. The market is still in an uptrend. We still prefer the bullish scenario. On the downside, though, below 1.0766 minor support will mix up the outlook and turn intraday bias neutral first.