What is needed to open long positions on GBP/USD
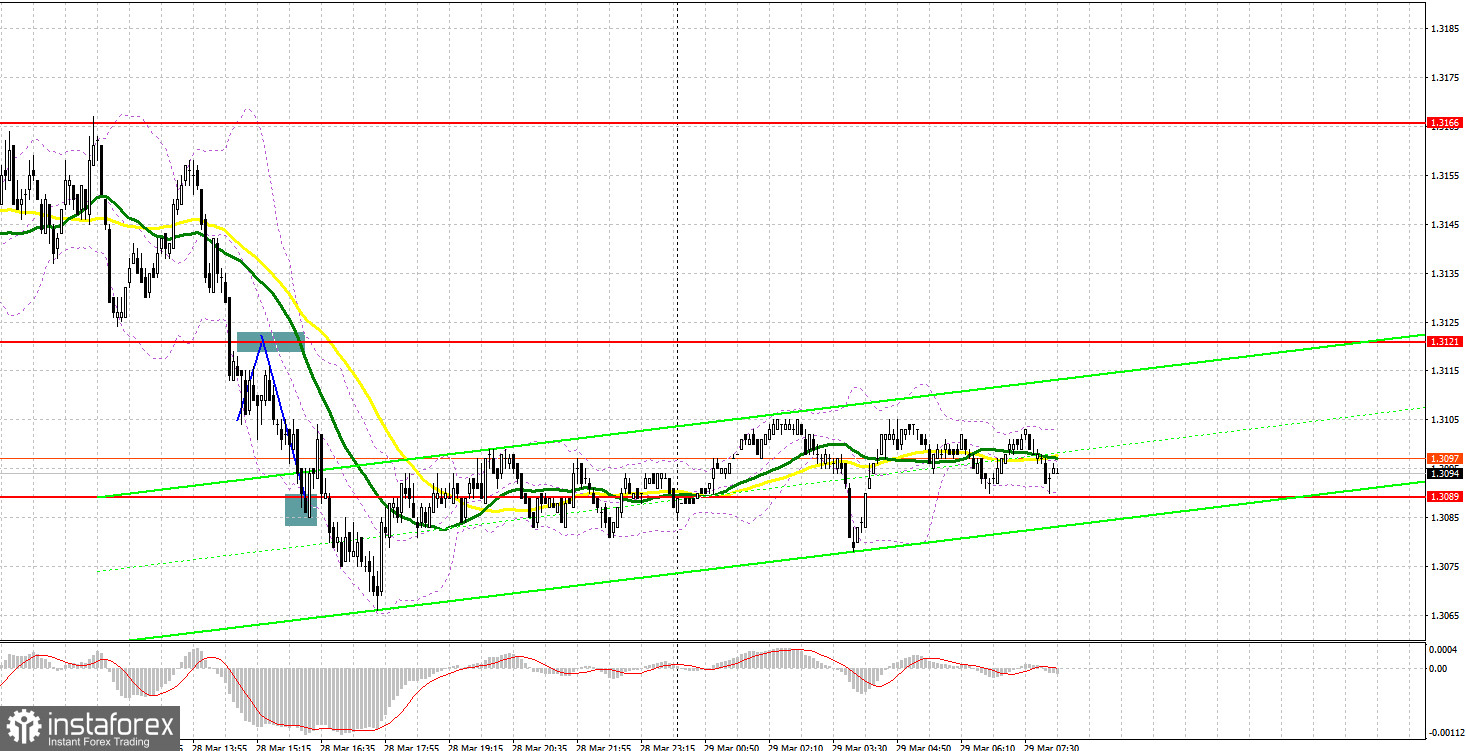
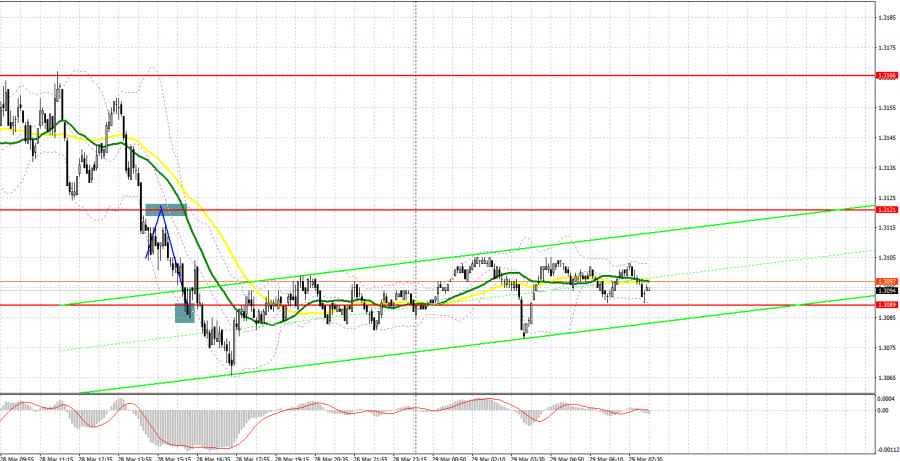
Yesterday, GBP/USD formed a few market entry points. Now let's have look at the 5-minute chart and try to figure out what actually happened and how we should have acted. Despite high volatility of GBP in the first half of the day, the currency pair was trading mostly sideways. Sadly, the price missed a few pips from the levels suggested by me. For this reason, the pair did not make any signals to enter the market. During the New York trade, GBP slumped in light of a speech by Bank of England Governor Andrew Bailey. The policymaker expanded on the wait-and-see approach. A breakout of 1.3121 was not tested upwards. So, we did not see a signal to open short positions. A false breakout of support at 1.3089 did not trigger a spike in GBP. After a 11-pips correction, the currency pair came under selling pressure.
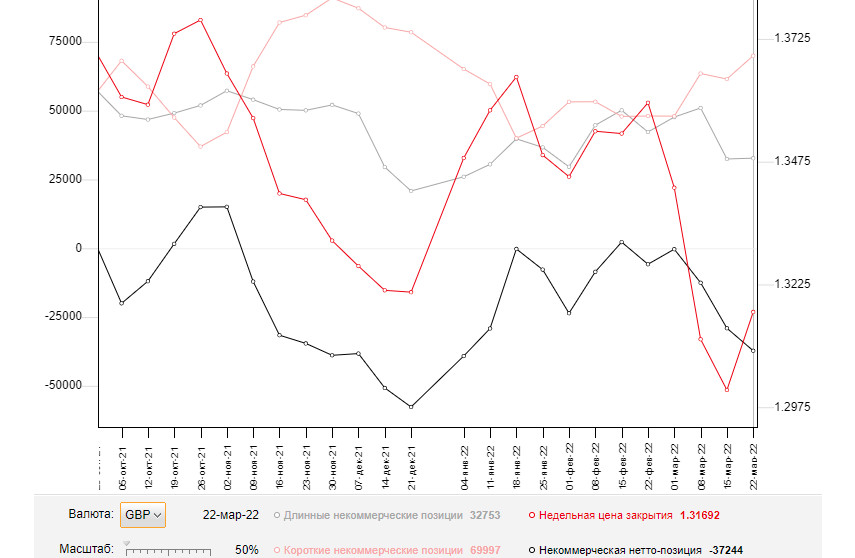
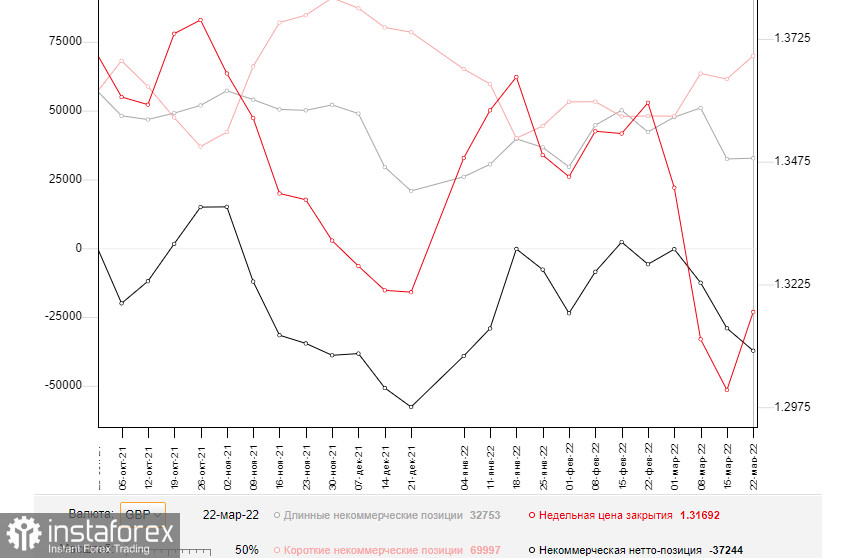
Before we figure out the technical picture of GBP/USD, let's discuss what has happened in the futures market. The COT report from March 22 logs a sharp increase in short positions and a minor growth of long positions. Some remarks of Fed policymakers last week put pressure on GBP. The sterling is still unable to regain bullish momentum due to headwinds in the UK economy that put a strain on households. Experts reckon warn that the living standard is set to go down. They cannot assess inflationary risks that hinder a normal pace of the economic development.
Soaring energy prices, the geopolitical tensions in Ukraine, the backlash of severe Western sanctions put a lid on the British economy. Softer stance of the Bank of England's Governor assured traders to sell the sterling this week. Sell-offs are likely to continue due to the lack of positive news. The only catalyst that GBP bulls can rely on is some progress in the talks between Russia and Ukraine and steps towards a peaceful solution. According to the COT report from March 22, long non-commercial positions increased from 32,442 to 32,753 whereas short non-commercial positions jumped from 61,503 to 69,997. As a result, the negative value of non-commercial net positions grew from -29.061 to -37,244. GBP/USD closed last Friday higher at 1.3169 against 1.3010 a week ago.
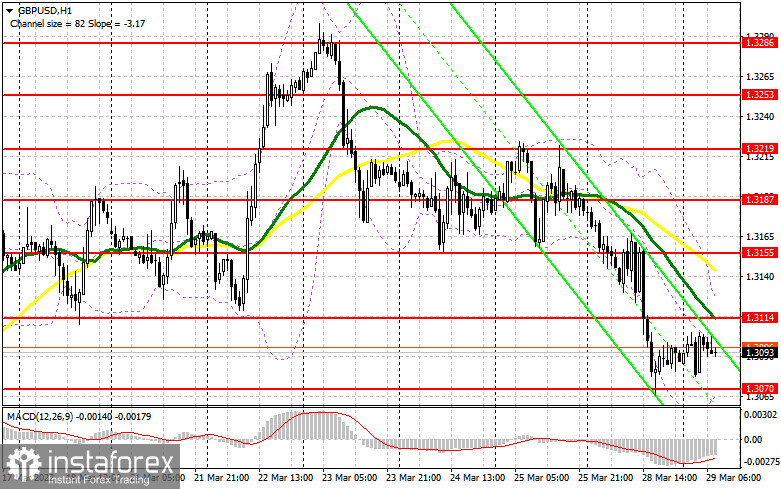
GBP buyers have trouble. It is hard to say what can help them in the short term to regain control over the currency pair. Divergence on the MACD indicator will create proper conditions to buy GBP of it declines to weekly lows today. Other factors to enable buying are a false breakout at 1.3070 alongside strong data on the M4 money supply and mortgage approvals. These factors can push GBP/USD to resistance at 1.3114 where moving averages are passing that are benefitting the bears. A quarterly survey released by the Bank of England can also contribute to an upward correction of GBP/USD. We are aware of fundamentals for GBP. Hence, the bears will step up pressure whenever the price tries to grow. The fundamental conditions for increasing short positions on GBP/USD are the hawkish rhetoric of Fed's Chairman Jerome Powell.
A breakout and a test of 1.3114 downwards will create an extra market entry point and invite ore buyers who will bet on growth to 1.3155. The price could print a higher high than 1.3187. A more distant target is seen at 1.3219 where I recommend profit taking. Notably, we will be able to reach this level on condition of good news on the geopolitical front. If case GBP declines in the European session and the bulls lack activity at 1.3070 (I guess it will happen), it would be better to cancel long positions on GBP/USD until a lower low at 1.3037 or larger support at 1.3003. Only a fake breakout at these levels could weaken the bearish trend and create a market entry point during a brief bounce. We could buy GBP/USD immediately at a drop from 1.2960, bearing in mind a 30-35 pips correction intraday.
What is needed to open short on GBP/USD
The bears are confident. They are expected to set the tone for a while. Escalating hostilities in Ukraine will benefit the sellers. On the other hand, any signs of progress in the talks will spook the bears that will open the way for GBP rapid growth. Please keep close tabs on developments in the Russia – Ukraine talks that are underway. GBP/USD is trading below moving averages, thus indicating that the pair is in the grips of the bears. The major task for the sellers is to defend 1.3114. A false breakout at this level will create a market entry point for short positions during a further downtrend. The sellers aim for a downward target at 1.3070. This level is worth fighting for. The level is a weekly low where MACD could form divergence that caps the bearish momentum.
A breakout and an opposite test of 1.3070 upwards will activate stop orders that will push GBP/USD to lows at 1.3037 and 1.3003. A lower target is seen at 1.2960 where I recommend setting a take profit order. In case the pair grows during the European session and the sellers lack activity at 1.3114, it would be better to cancel selling until 1.3155. I would recommend opening short positions there in case of a false breakout. We could sell GBP/USD immediately at a bounce off a high at 1.3187 or higher from 1.3219, bearing in mind a 30-35 pips drop intraday.
Indicators' signals:
Trading is carried out below the 30 and 50 daily moving averages. It indicates the ongoing bearish trend.
Moving averages
Note: The period and prices of moving averages are considered by the author on the H1 hourly chart and differs from the general definition of the classic daily moving averages on the daily D1 chart.
Bollinger Bands
A breakout of the indicators' lower border at 1.3070 will weigh down on GBP/USD. Alternatively, a breakout of the upper border will set the stage for a new bullish wave in GBP/USD.
Description of indicators
- Moving average (moving average, determines the current trend by smoothing out volatility and noise). Period 50. It is marked yellow on the chart.
- Moving average (moving average, determines the current trend by smoothing out volatility and noise). Period 30. It is marked green on the chart.
- MACD indicator (Moving Average Convergence/Divergence — convergence/divergence of moving averages) Quick EMA period 12. Slow EMA period to 26. SMA period 9
- Bollinger Bands (Bollinger Bands). Period 20
- Non-commercial speculative traders, such as individual traders, hedge funds, and large institutions that use the futures market for speculative purposes and meet certain requirements.
- Long non-commercial positions represent the total long open position of non-commercial traders.
- Short non-commercial positions represent the total short open position of non-commercial traders.
- Total non-commercial net position is the difference between short and long positions of non-commercial traders.