What is needed to open long positions on EUR/USD
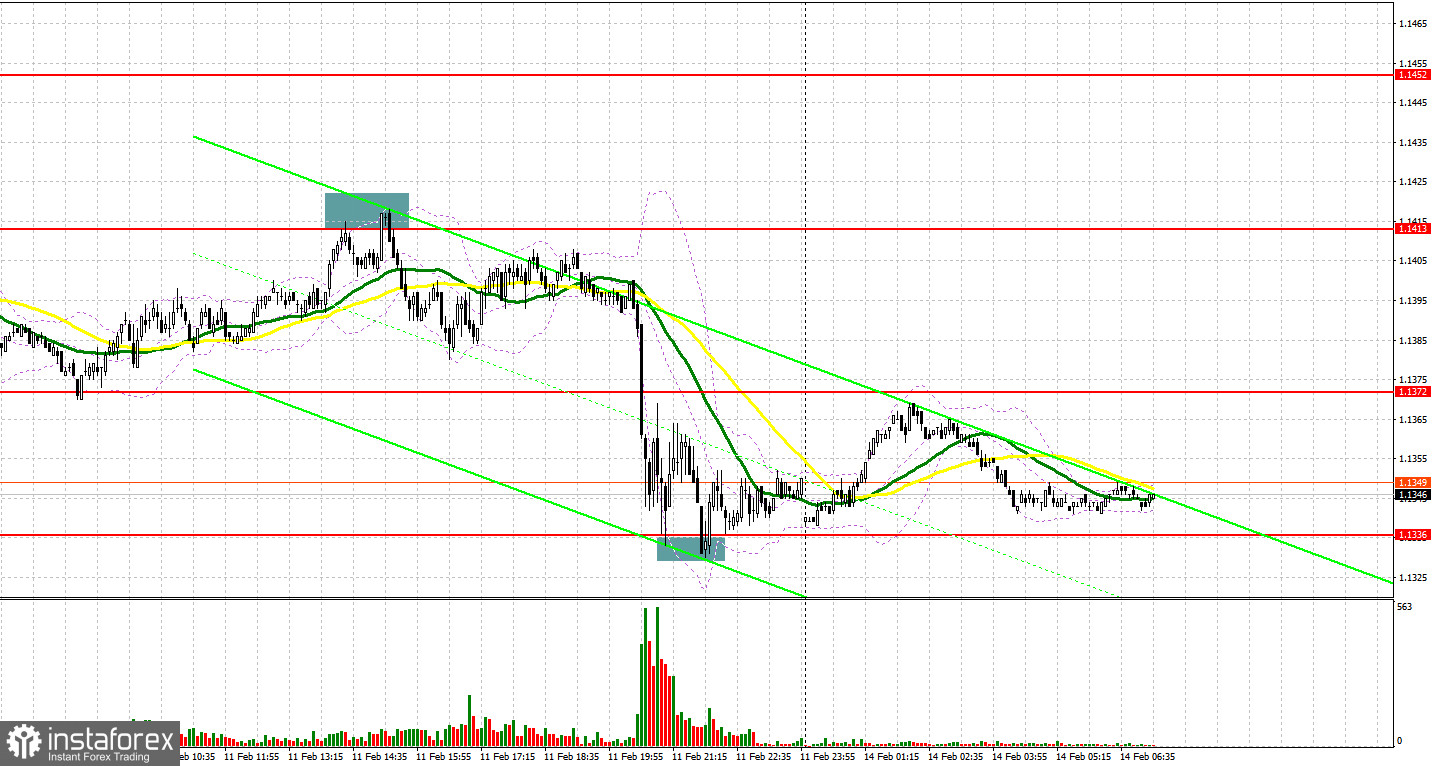
On Friday, EUR/USD created a few signals to enter the market. Now let's look at the 5-minute chart and try to figure out what actually happened. In my review released on Friday afternoon, I turned your attention to some levels under higher volatility. Traders neglected the fundamental background from the EU. So, the price failed to touch none of the levels. Germany's inflation came in line with expectations. As a result, the currency pair traded sideways and did not create any market entry points. In the second half of the day, we saw a false breakout at about 1.1413 that generated an excellent point to sell EUR. All in all, the price decline more than 70 pips. The bulls entered the market at about support of 1.1336 where a false breakout gave a signal to buy EUR at the end of the day. EUR grew nearly 40 pips against USD.
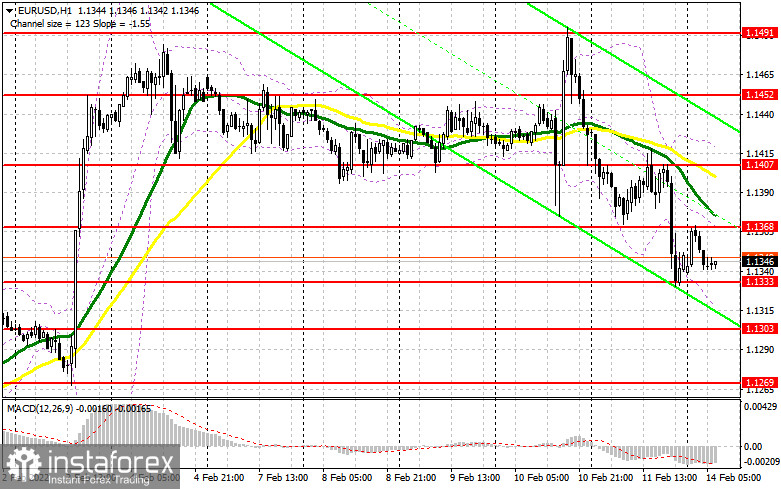
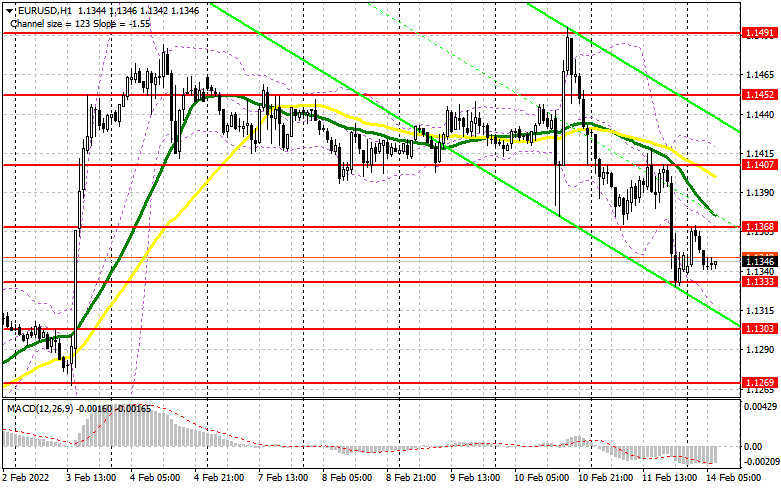
EUR is trading under selling pressure. The bullish outlook for EUR is in question. The main task for the bulls is to protect the nearest support of 1.1333, the lowest level of the last week. The economic calendar for the EU lacks any important data today. Besides, escalating political jitters in East Europe don't add to the buyers' optimism. Now we will have a market entry point with long positions only in case there a false breakout at 1.1333. By and large, for the euro's recovery, the bulls have to be more active on condition risk-on mood revives.
The important task for the bulls is to control the nearest resistance of 1.1368. Moving averages are passing slightly above it which benefits the bears. A breakout of this level and consolidation above it will cement the bulls' confidence. A test of 1.1368 downwards will generate another buy signal and open the door to 1.1407. The buyers will feel relieved around this level because a breakout of it will revive the uptrend and open the way towards 1.1452 and 1.1491 where I recommend profit taking. Nevertheless, we can rely on such huge growth after a speech by ECB President Lagarde who is due to speak in the second half of the day. In the pair declines in the European trade and the bulls lack activity at 1.1333, it would be better not to rush opening long positions. The reasonable scenario would be to wait for a breakout t 1.1303. We could buy EUR at a drop off 1.1269 or lower at 1.1235, bearing in mind a 20-25 pips intraday correction.
What is needed to open short positions on EUR/USD
The sellers unexpectedly entered the market in the late American session on Friday. It pushed EUR down so that the pair updated weekly lows. This price action is a bad sign for those who reckoned a further bullish trend. The economic calendar today doesn't contain any important statistics. Hence, EUR/USD will remain under pressure. In the first half of the day, the bears should try their best not to miss 1.1368 to retain control over the market. A fake breakout like in the case described above will be a signal to open short positions with the downward target of 1.1333. A breakout and a test upwards of this area will generate an extra signal to open short positions aiming for deeper targets of 1.1303 and 1.1269. A more distant target is seen at 1.1235 where I recommend profit taking. However, this large drop would be possible in case of further escalation of the conflict between Russia and Ukraine and a threat of military clashes. This scenario will boost demand for safe haven assets.
In case EUR grows and the bears trade sluggishly at 1.1368, it would be better not to rush to sell EUR/USD. The reasonable scenario would be short positions at a false breakout at about 1.1407. We could sell EUR/USD immediately at a bounce off 1.1452 or higher from 1.1491, bearing in mind a downward 15-20 pips intraday correction.
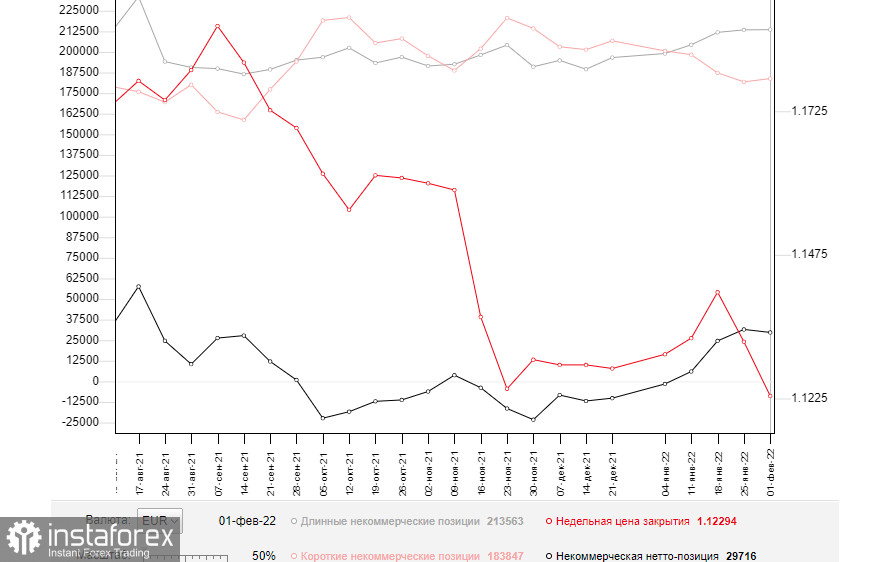
The COT report from February 1 logs an increase of both long and short positions. The latter grew at a slightly larger degree. As a result, the positive delta contracted a bit. Notably, the COT data doesn't allow for the ECB policy meeting when Christine Lagarde sent a message across financial markets that the regulator would take drastic actions if soaring persists in the euro area. According to the fresh inflation report, the fundamental picture doesn't suggest that inflationary pressure will ease in the near future. This is a bullish sign for the euro because the ECB has turned hawkish for the first time ever, considering a rate hike this year. On the other hand, we should not forget about the Fed's plan to raise interest rates in March 2022. Such prospects will dampen the zeal of the euro buyers. Some market participants expect the US Fed to resort to aggressive tightening with a rate hike of 0.5% at a time, not just 0.25%. This is bullish for USD.
According to the latest COT report, long non-commercial positions jumped from 181,848 to 183,847. It means that traders are increasing long positions. The next COT report will reveal that buyers are more numerous, taking into account the ECB policy decisions in February. Last week, the overall non-commercial net positions went down a bit to 29,716 against 31,569. EUR/USD closed the week lower at 1.1229 against 1.1323 from a week ago.
Indicators' signals:
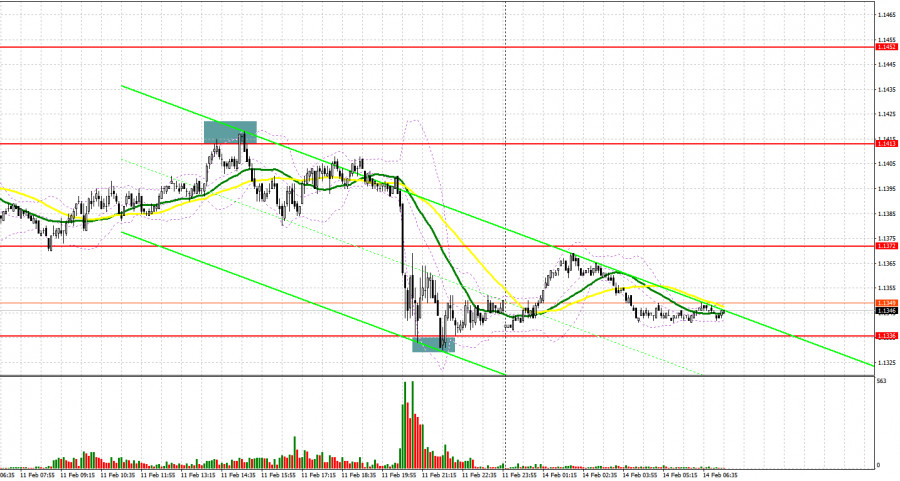
Trading is carried out below the 30 and 50 daily moving averages. It indicates that the sellers are ruling the market.
Moving averages
Note: The period and prices of moving averages are considered by the author on the H1 hourly chart and differs from the general definition of the classic daily moving averages on the daily D1 chart.
Bollinger Bands
A breakout of the indictor's lower border at about 1.1325 will entail a steeper fall of EUR/USD.
Description of indicators
- Moving average (moving average, determines the current trend by smoothing out volatility and noise). Period 50. It is marked yellow on the chart.
- Moving average (moving average, determines the current trend by smoothing out volatility and noise). Period 30. It is marked green on the chart.
- MACD indicator (Moving Average Convergence/Divergence — convergence/divergence of moving averages) Quick EMA period 12. Slow EMA period to 26. SMA period 9
- Bollinger Bands (Bollinger Bands). Period 20
- Non-commercial speculative traders, such as individual traders, hedge funds, and large institutions that use the futures market for speculative purposes and meet certain requirements.
- Long non-commercial positions represent the total long open position of non-commercial traders.
- Short non-commercial positions represent the total short open position of non-commercial traders.
- Total non-commercial net position is the difference between short and long positions of non-commercial traders.