To open long positions on EUR/USD, we need the following conditions:
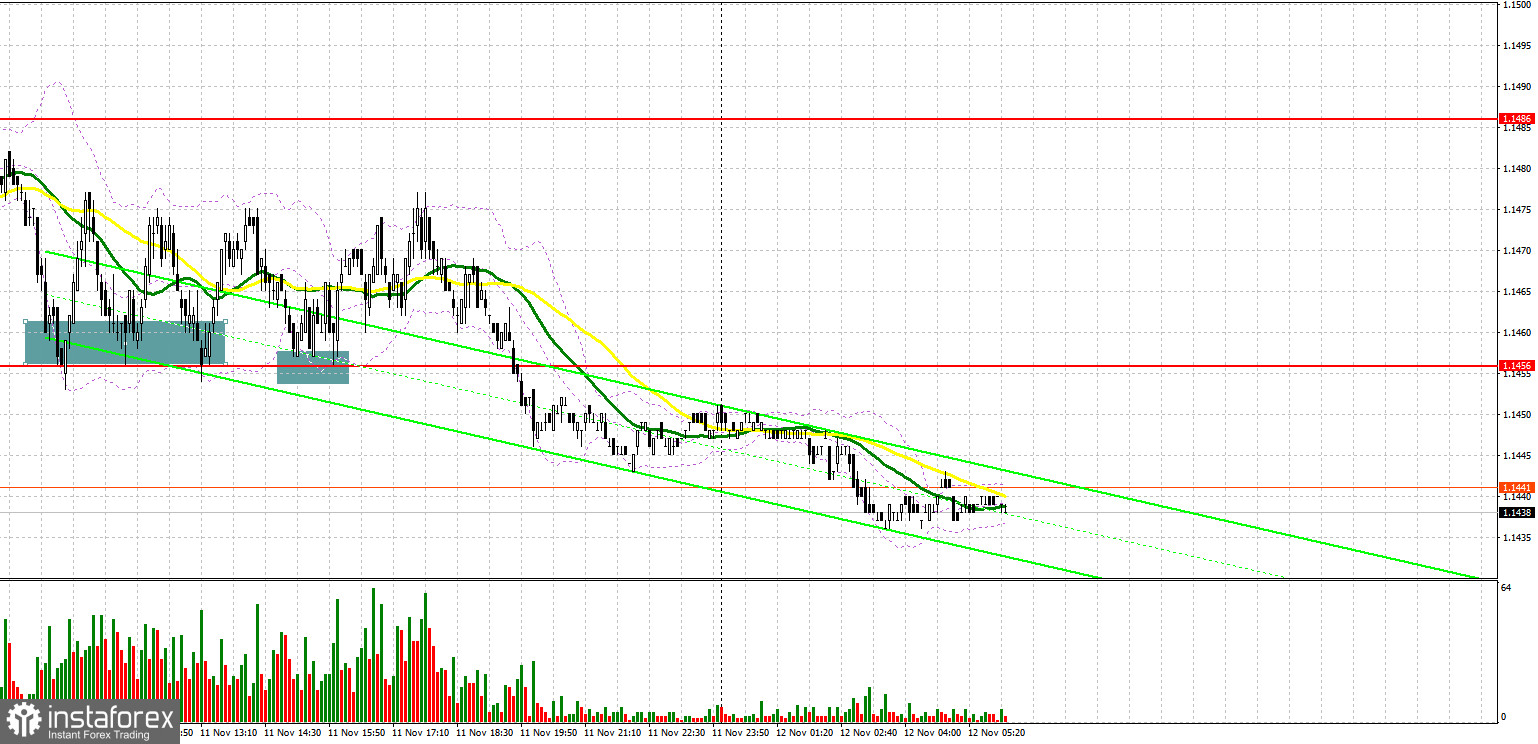
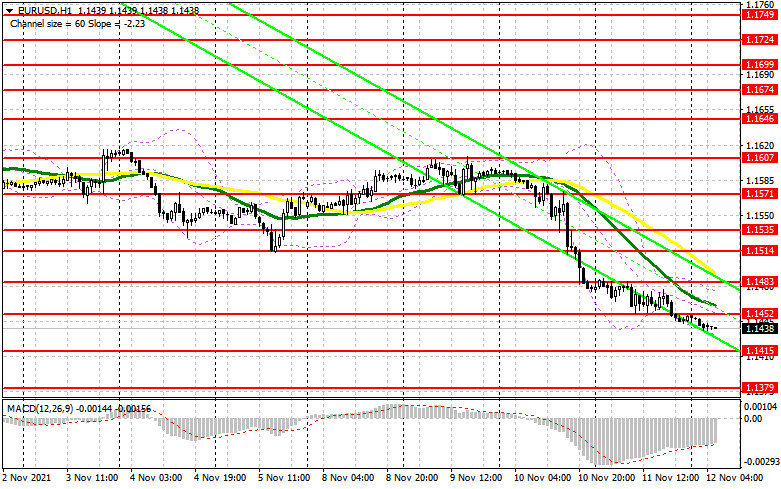
Yesterday, trading unfolded quietly. Let's look at the 5M chart and figure out the entry points. In the first half of the day, bears tried to maintain the pressure on the pair. They gained momentum following the US inflation report. A long signal appeared on the chart after several unsuccessful bears' attempts to drag the pair below 1.1460. Apparently, the pair was unable to rebound significantly. It rose by only 15 pips. In the second half of the day, trading activity was also muted as trading floors in the US were closed for a holiday. There was a false breakout of 1.1456 and an entry point into long positions appeared. As a result, the pair gained 20 pips.
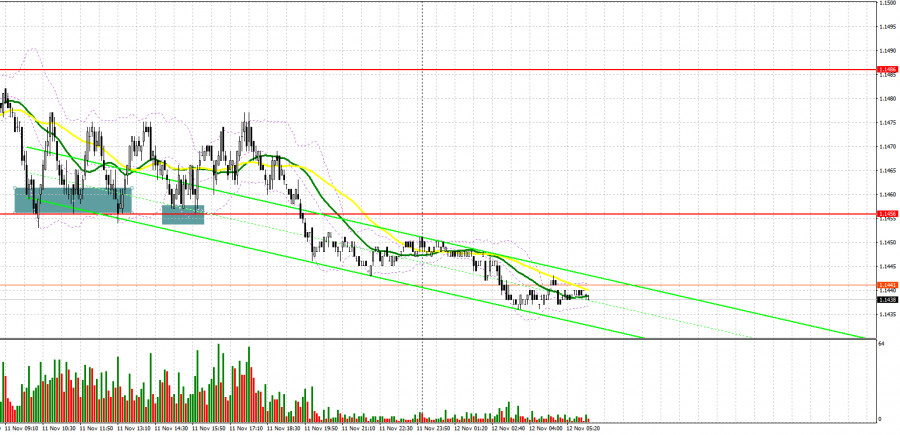
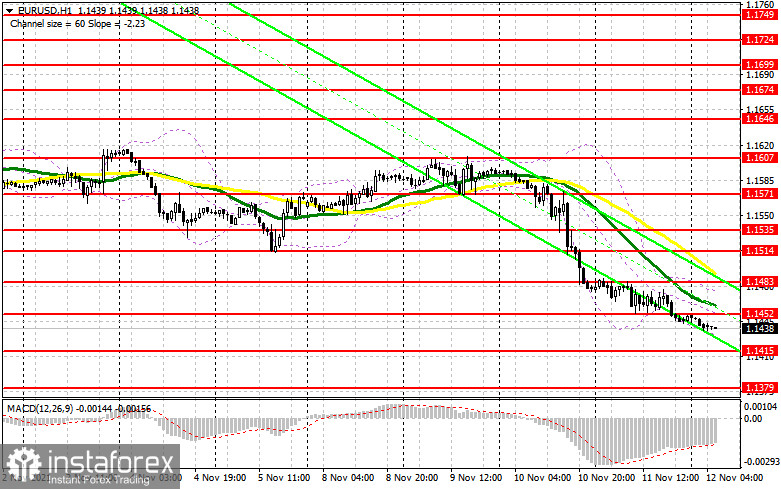
During today's Asian session, the pair fell below yesterday's support level of 1.1452. Bears continue to exert pressure on the euro. Bulls are now expecting EU industrial production data. If the figures turn out to be positive, bulls may take the upper hand. Nevertheless, analysts believe that such a scenario is unlikely to occur. Traders may close their Take Profit orders in the afternoon. During the European session, bulls may resume ground if they push the price above 1.1452. If so, it may stop the downward trend. The test of 1.1452 from top to bottom after the publication of EU and Germany data will give an entry point for long positions. This scenario is likely to happen if the EUR/USD rises to 1.1483. At this level, the moving averages are in the downward area. This may limit the upward movement of the pair. A new long signal may appear if the pair breaks through this range. The pair is likely to grow to a high of 1.1514. It is recommended to lock in profit at this level. A more distant target level is 1.1535. If the pressure on EUR/USD persists in the first half of the day, only the formation of a false breakdown in the 1.1415 area with the divergence on the MACD indicator, which is now clearly visible on the 1H chart, will limit the fall of the euro. It will lead to the formation of a long signal and an upward correction. If there is no activity around the level of 1.1415, it is best to wait for the formation of a false breakout of 1.1379. So, it is better to open long positions on EUR/USD immediately for a rebound from the low of 1.1330, counting on an intraday correction of 15-20 pips.
To open short positions on EUR/USD, we need the following conditions:
Bears are now in full control. They need to protect the 1.1452 level. It has been broken during the Asian session. Bears will strengthen even more if EU industrial data for September turn out to be disappointing. It may lead to the formation of a false breakout of 1.1452. Then, the first signal to open short positions is likely to appear. It is better to open short positions closer to the support level of 1.1415. A breakthrough of this level will increase pressure on EUR/USD, pushing it to the new lows -1.1379 and 1.1330. It is recommended to close short positions at this level. If the euro rises during the European session and bears fail to push the quotes to 1.1452, it is better to postpone sales until the test of the next resistance level of 1.1483. At this level, the moving averages are in the downward area. Even at this level, it would be a wise decision to open short positions after the formation of a false breakout. It is recommended to open short positions on EUR/USD immediately on a rebound to 1.1514. You can count on a downward correction of 15-20 pips.
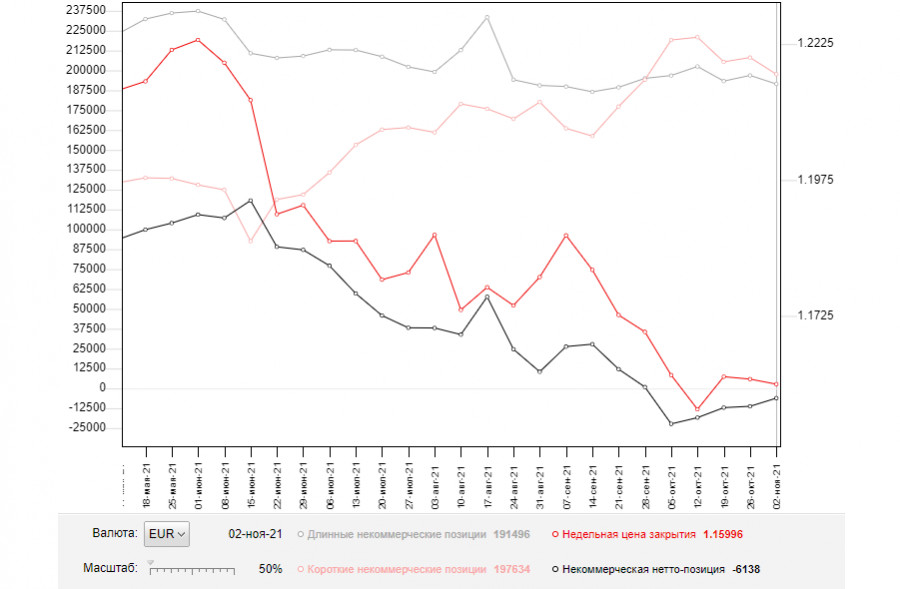
COT report
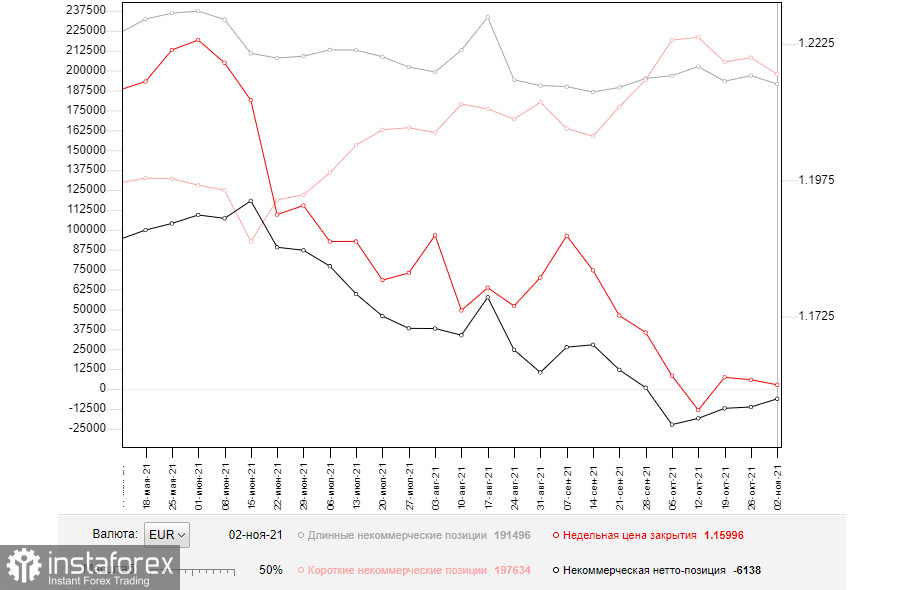
The COT report (Commitment of Traders) for November 2 showed a drop in both short and long positions, which led to a slight recovery of the negative delta. It indicates that more sellers left the market than buyers. The meetings of central banks did not lead to significant changes. The Fed announced measures to support the economy, fueling optimism across the market. So, traders believe in the continuation of the economic recovery. Some analysts believe that the European Central Bank will have to tighten monetary policy earlier than planned due to high inflation. If so, bulls will have the chance to gain momentum in the medium term. Now, there is a curious situation: after each steep drop, demand for the euro recovers quite quickly. In the near future traders will assess US inflation data. The results of this report will determine the future trajectory of the US dollar against its major rivals. The COT report reveals that the number of long non-commercial positions decreased to 191,496 from 196,880, while short non-commercial positions fell to 197,634 from 208,136. At the end of the week, the total number of non-commercial net positions recovered slightly and amounted to -6,388 against -11,256. The weekly closing price slightly declined to the level of 1.1599 against 1.1608.
Indicator signals:
Moving Averages
If trading is carried out below the 30 and 50 day moving averages, which indicates a bear market.
Note: The period and prices of moving averages viewed by the author on the 1H differ from the general definition of the classic daily moving averages on the daily chart.
Bollinger Bands
In case of a rise, the upper limit of the indicator at 1.1475 will act as resistance. A breakout of the lower limit of the indicator at 1.1440 will increase pressure on the euro.
Description of indicators
- Moving average (moving averages filter out the noise and make it easier to identify trends). Period 50. It is marked in yellow on the chart.
- Moving average (moving averages filter out the noise and make it easier to identify trends). Period 30. It is marked in green on the graph.
- MACD indicator (Moving Average Convergence/Divergence - convergence/divergence of moving averages) Fast EMA period 12. Slow EMA period 26. SMA period 9
- Bollinger Bands. Period 20
- Non-profit speculative traders, such as individual traders, hedge funds, and large institutions that use the futures market for speculative purposes and meet certain requirements.
- Long non-commercial positions show the total number of long position of non-commercial traders.
- Short non-commercial positions show the total number of short position of non-commercial traders.
- The total non-commercial net position is the difference between the short and long positions of non-commercial traders.