To open long positions on EUR/USD, you need:
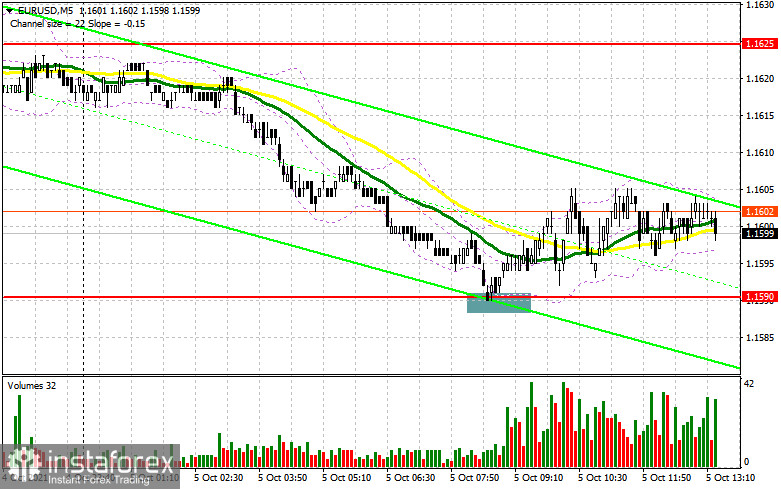
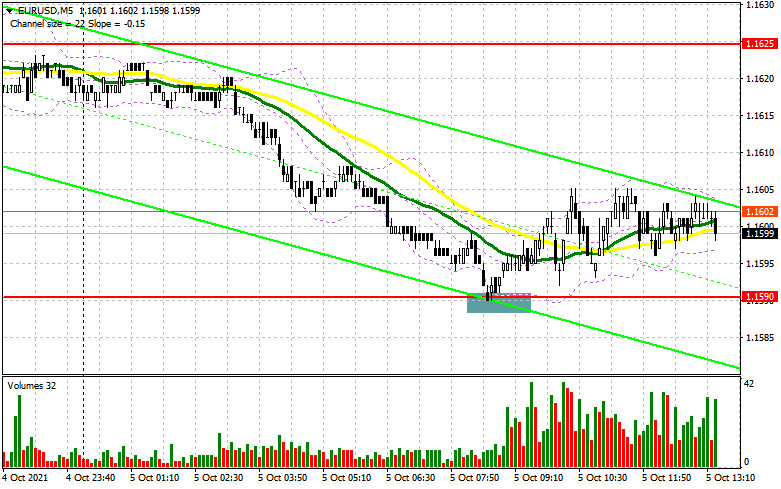
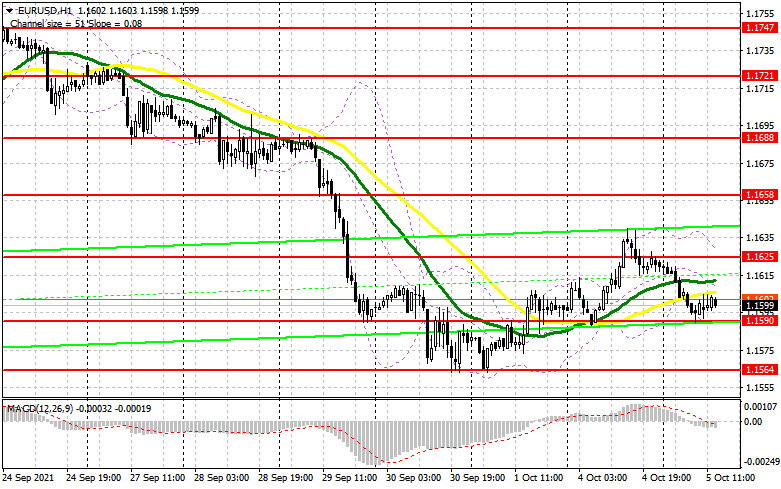
Weak data on the eurozone service sector activity, which has been contracting for the second month in a row, prevented euro buyers from seizing the initiative in the first half of the day. However, there is no desire to sell EUR/USD at the current lows after the Asian sell-off of the pair. Let's observe the 5-minute chart and discuss the possible ways to enter the market. A test of the 1.1590 level in the morning caused a false break and was a signal to open long positions. However, there was no rapid euro's rise.The pair went up about 12 pips and ended the trade. From the technical point of view, nothing has changed in the second half of the day. Now, we should pay attention to the similar reports on the US services sector activity. European Central Bank President Christine Lagarde's speech will be highly significant. Her statements may favor the euro, which is essential for buyers at the moment. Any hints about policy revision are likely to result in the pair's recovery. The bulls' initial target for the second half of the day is the breakout of 1.1625. The moving averages, sticking to buyers' interests, pass below it. Besides, testing this area from top to bottom forms a signal to open long positions, counting on further recovery and upward correction, which is about to end. In this case the nearest target is 1.1658. Its breakout with a similar fixation will form an additional entry point to buy. It will take the EUR/USD pair to new local levels of 1.1688 and 1.1721, where I recommend to take profit. If the pressure on the pair and the US strong data service sector activity remain stable, long positions may be opened with a false break around 1.1590, near which the pair is trading now. I recommend buying EUR/USD on the rebound only after the first test of the September low around 1.1564, or even lower, from the level 1.1538, considering 15-20 pips intraday rebound. This area update will indicate the resumption of a bearish trend.
To open short positions on EUR/USD you need:
The bears control the market, taking advantage of bad eurozone statistics and US political problems. We mean another US Senate vote failure on raising the debt ceiling. Then the focus will shift to the US service sector activity statistics, though it is unlikely to be a major divergence from the economists' forecasts. Moreover, this fact will exert further pressure on the euro in the second half of the day. Forming a false break at 1.1625, where the moving averages pass, would be a signal to open short positions. This will give an excellent entry point to buy with the target to the major support decline at 1.1590. Besides, the bears failed to climb below it in the first half of the day. Only retesting with the breakout and update of 1.1590 from bottom to top will increase the pressure on the pair and open the way to the lows of 1.1564 and 1.1538, where I recommend to take profit. If the pair demonstrates growth and there is no bearish activity around 1.1625 today during the American session I recommend to open short positions only after a false break at 1.1658. It is better to sell EUR/USD on the rebound only after testing a new local resistance at 1.1688, considering a downward correction of 15-20 pips.
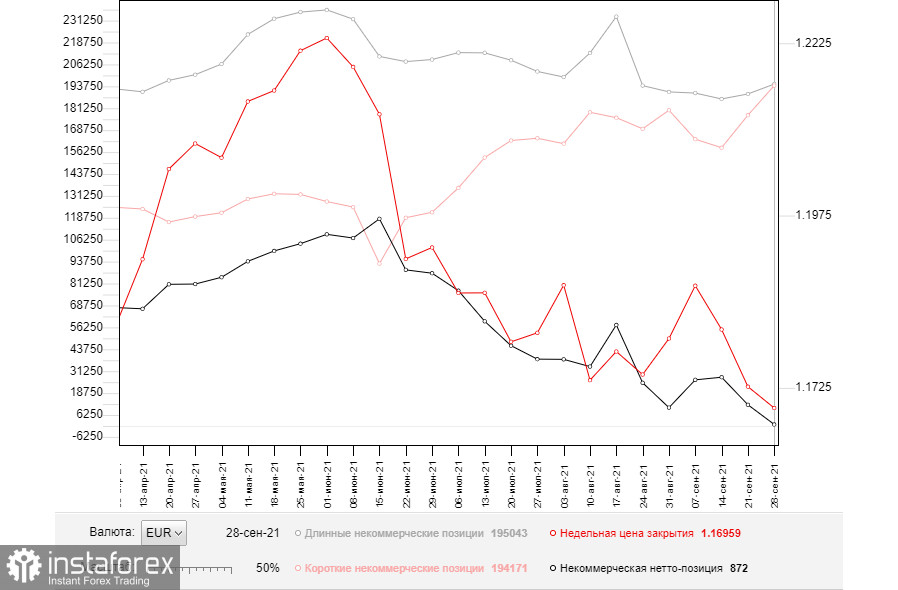
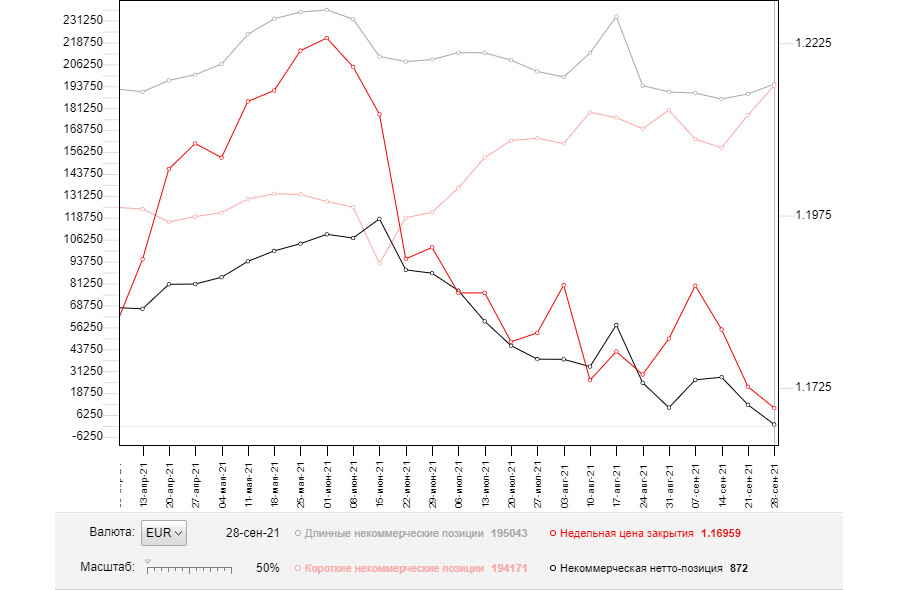
The COT report (Commitment of Traders) for September 28 recorded a sharp increase in both short and long positions. However, the former were more numerous, which caused a decrease in the net position. The fact that the United States is now going through tough political times kept up with demand for the US dollar and put pressure on risky assets all last week. The prospect of the Federal Reserve monetary policy changes in November this year also allowed traders to build up long positions in the USD without much difficulty. Besides, many investors expect the central bank to start reducing its bond-buying program by the end of this year. This week a key report on US nonfarm payrolls data is due. It will give a hint on further central bank actions, as a lot depends on labor market indicators now. Demand for risky assets will remain limited due to the high risk of another wave of COVID-19 and its new Delta variant. Last week, the President of the European Central Bank stated that she would maintain a wait-and-see approach and follow stimulative policy at current levels. However, the observed spike in inflationary pressures in the 4th quarter of this year could undermine the regulator's plans. The COT report showed that long non-commercial positions rose from 189,406 to 195,043, while short non-commercial positions surged dramatically, from 177,311 to 194,171. At the end of the week, the total non-commercial net position dropped from 12,095 to 872 levels. The weekly close was also down to 1.1695 from 1.1726.
Indicator signals:
Moving averages
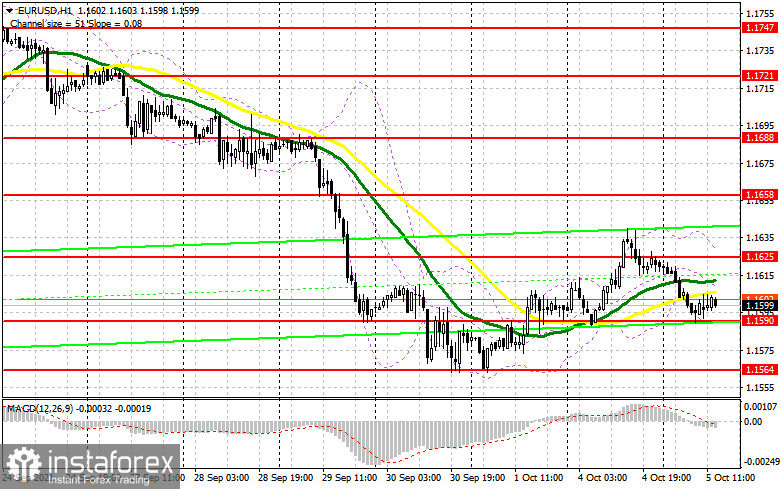
Trading is conducted below the 30 and 50 daily moving averages, indicating that buyers are having difficulties with further euro's rise.
Note: The period and prices of moving averages are considered by the author on the hourly chart H1 and differ from the general definition of classic daily moving averages on daily chart D1.
Bollinger Bands
A break of the middle boundary of the indicator in the area of 1.1615 will result in a new wave of growth of the euro. A break of the lower boundary of the indicator at 1.1590 will increase the pressure on the pair.
Description of indicators
- Moving average (moving average determines the current trend by smoothing out volatility and noise). Period 50. On the chart, it is marked in yellow.
- Moving average (moving average determines the current trend by smoothing out volatility and noise). Period 30. On the chart, it is marked in green.
- MACD (Moving Average Convergence/Divergence - moving average convergence/divergence) Fast EMA period 12. Slow EMA period 26. SMA period 9
- Bollinger Bands (Bollinger Bands). Period 20
- Non-commercial traders are speculators, such as individual traders, hedge funds and large institutions, which use the futures market for speculative purposes and meet certain requirements.
- Long non-commercial positions represent the total long open position of non-commercial traders.
- Short non-commercial positions represent the total short open position of non-commercial traders.
- The total non-commercial net position is the difference between short and long positions of non-commercial traders.