empty
26.03.2025 05:26 AM
EUR/USD and GBP/USD March 26 – Technical Analysis

EUR/USD

This image is no longer relevant

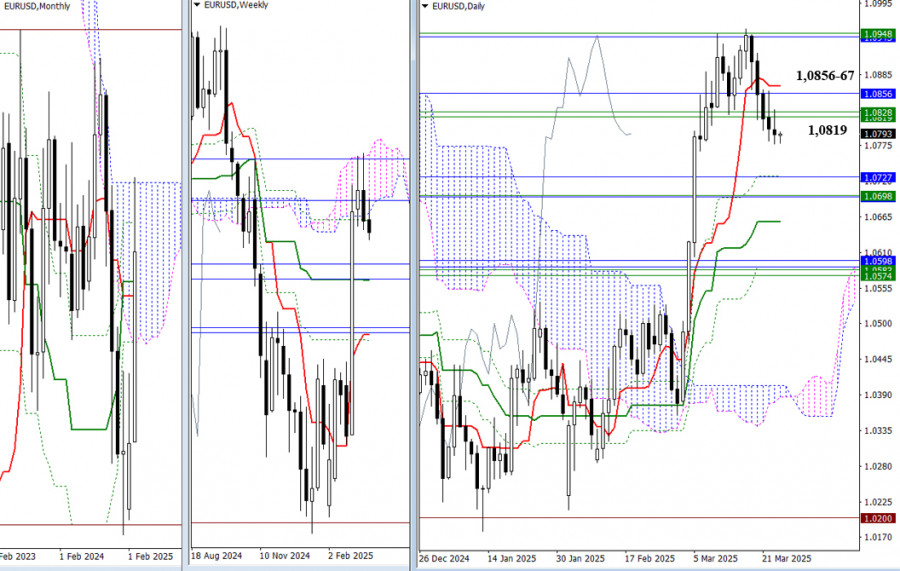
As the week begins, bearish players are trying to confirm and extend the prevailing downtrend, but they have yet to achieve strong results — The pair continues to stay close to the weekly levels. (1.0819 – 1.0828). If the decline does progress, the nearest target and next support zone for today lies at 1.0727 – 1.0698 (monthly Tenkan and Kijun lines + the weekly medium-term trend). If bears lack the strength to push lower and their opponents seize the initiative, the bulls' first step will be to reclaim the levels 1.0819 – 1.0856 – 1.0867 and consolidate above them.

This image is no longer relevant

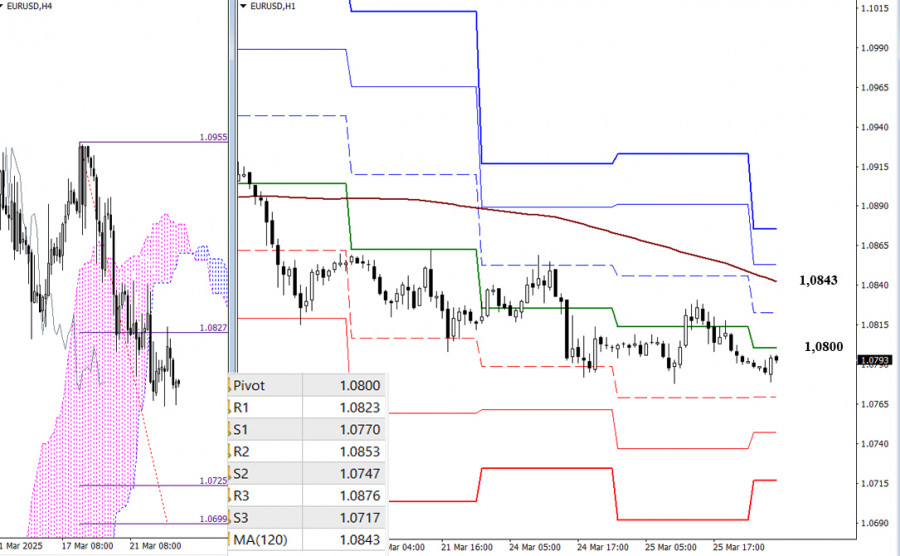
On the lower timeframes, bearish players are currently developing a downward trend. Their targets today include support from the classic Pivot levels (1.0770 – 1.0747 – 1.0717) and the breakout zone of the H4 Ichimoku cloud (1.0725 – 1.0699). If an upward correction develops, the market may encounter resistance near 1.0800 – 1.0823. However, the key level for the bulls will be testing and breaking through the weekly long-term trend line (1.0843). A breakout and reversal of the trend could shift the balance of power in favor of strengthening bullish sentiment. Additional intraday upside targets may include 1.0853 – 1.0876 (classic Pivot resistance levels).

***

GBP/USD

This image is no longer relevant

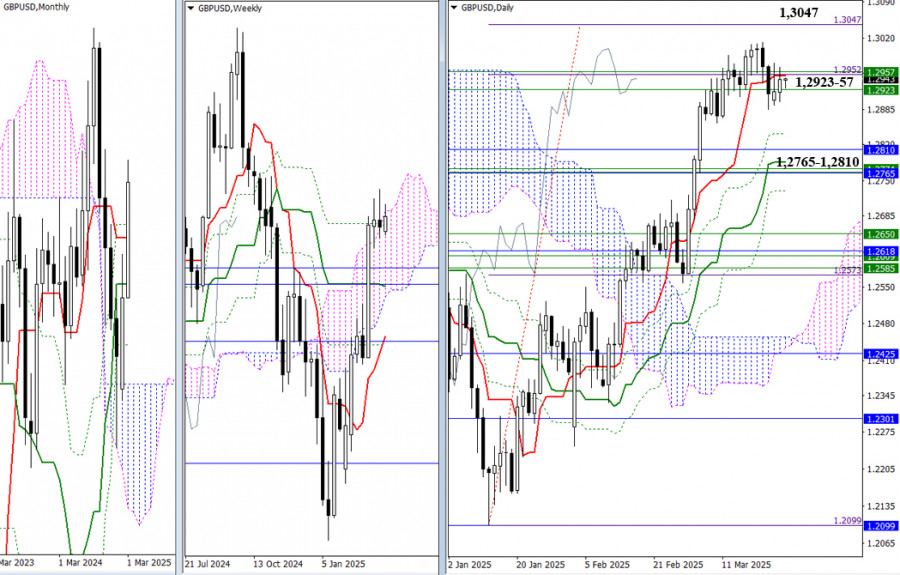
Uncertainty persists. The pound remains closely linked to its weekly levels (1.2923 – 1.2957) and the daily short-term trend line (1.2950). All other key levels have also remained in place. The nearest bullish target is the complete achievement of the daily cloud breakout goal at 100% (1.3047), while bearish targets are still clustered around support from multiple timeframes, led by the monthly support zone at 1.2765 – 1.2810.

This image is no longer relevant

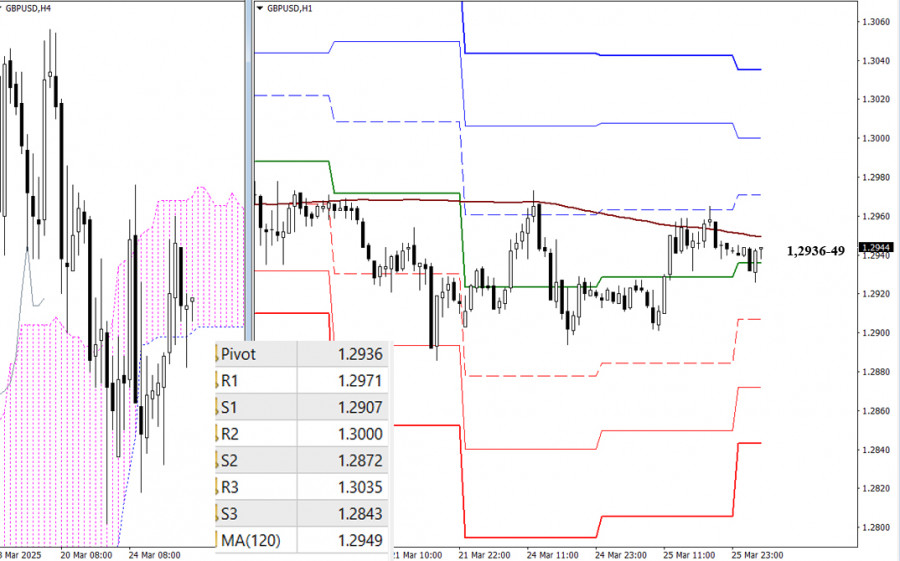
On the lower timeframes, the market is currently testing the key levels at 1.2936 (central Pivot level) and 1.2949 (weekly long-term trend). A breakout and consolidation above these levels would help bulls shift the balance of power and gain a stronger advantage. A rejection would create an opportunity for further declines. Today's bearish intraday trend targets include the classic Pivot supports at 1.2907 – 1.2872 – 1.2843.

***

Technical Analysis Components:
  • Higher Timeframes: Ichimoku Kinko Hyo (9.26.52) and Fibonacci Kijun levels
  • H1: Classic Pivot Points and 120-period Moving Average (weekly long-term trend)
Evangelos Poulakis,
Analytical expert of InstaForex
© 2007-2025
Select timeframe
5
min
15
min
30
min
1
hour
4
hours
1
day
1
week
Earn on cryptocurrency rate changes with InstaForex
Download MetaTrader 4 and open your first trade
  • Grand Choice
    Contest by
    InstaForex
    InstaForex always strives to help you
    fulfill your biggest dreams.
    JOIN CONTEST

Recommended Stories

Technical Analysis of Intraday Price Movement of Nasdaq 100 Index, Thursday May 22, 2025.

With the appearance of Divergence between the Nasdaq 100 index price movement which formed a Double Top with the Stochastic Oscillator indicator plus confirmation with its price movement which moved

Arief Makmur 07:01 2025-05-22 UTC+2

Technical Analysis of Intraday Price Movement of USD/CHF Main Currency Pairs, Thursday May 22, 2025

As we can see on the 4-hour chart of USD/CHF main currency pair, some interesting information appears, namely first the appearance of Divergence between the price movement of USD/CHF with

Arief Makmur 07:01 2025-05-22 UTC+2

EUR/USD Forecast for May 22, 2025

On Wednesday, the euro successfully consolidated above the 1.1266 level and the balance indicator line. The next target levels are 1.1420 and 1.1535. The Marlin oscillator is about to enter

Laurie Bailey 05:06 2025-05-22 UTC+2

GBP/USD Forecast for May 22, 2025

Yesterday's inflation data for April in the UK surprised market participants. Core CPI jumped from 3.4% y/y to 3.8% y/y versus an expected 3.6% y/y, while headline CPI reached 3.5%

Laurie Bailey 05:06 2025-05-22 UTC+2

USD/JPY Forecast for May 22, 2025

The USD/JPY pair has been declining for eight consecutive days — a pattern not seen since 2019. However, we recently saw two five-week declines in July 2024 and November–December 2023

Laurie Bailey 05:06 2025-05-22 UTC+2

XAG/USD. Analysis and Forecast

Silver is rising toward the $33.25 level, consolidating near the upper boundary of its familiar range. The emergence of buying on pullbacks, a recent rebound from the 100-day Simple Moving

Irina Yanina 18:43 2025-05-21 UTC+2

Trading Signals for EUR/USD for May 21-25, 2025: sell below 1.1370 (200 EMA - overbought)

Early in the American session, the EUR/USD pair is trading around 1.1327, showing fading bullish strength. Having reached the top of the uptrend channel, EUR/USD is going through a technical

Dimitrios Zappas 17:50 2025-05-21 UTC+2

Trading Signals for GOLD (XAU/USD) for May 21-25, 2025: buy above $3,281 (200 EMA - 6/8 Murray)

Early in the American session, gold is trading around 3,304, above the 6/8 Murray level, and within the uptrend channel formed on May 14. Gold is expected to continue rising

Dimitrios Zappas 17:47 2025-05-21 UTC+2

Forecast for EUR/USD on May 21, 2025

On Tuesday, the EUR/USD pair managed to consolidate above the resistance zone of 1.1260–1.1282, which had previously triggered three pullbacks. As a result, the euro's upward movement continued

Samir Klishi 11:19 2025-05-21 UTC+2

Forecast for GBP/USD on May 21, 2025

On the hourly chart, the GBP/USD pair on Tuesday made two bounces from the support zone of 1.3344–1.3357, reversed in favor of the pound, and rose above the 1.3425 level

Samir Klishi 11:15 2025-05-21 UTC+2
Can't speak right now?
Ask your question in the chat.
Widget callback
 

Dear visitor,

Your IP address shows that you are currently located in the USA. If you are a resident of the United States, you are prohibited from using the services of InstaFintech Group including online trading, online transfers, deposit/withdrawal of funds, etc.

If you think you are seeing this message by mistake and your location is not the US, kindly proceed to the website. Otherwise, you must leave the website in order to comply with government restrictions.

Why does your IP address show your location as the USA?

  • - you are using a VPN provided by a hosting company based in the United States;
  • - your IP does not have proper WHOIS records;
  • - an error occurred in the WHOIS geolocation database.

Please confirm whether you are a US resident or not by clicking the relevant button below. If you choose the wrong option, being a US resident, you will not be able to open an account with InstaForex anyway.

We are sorry for any inconvenience caused by this message.