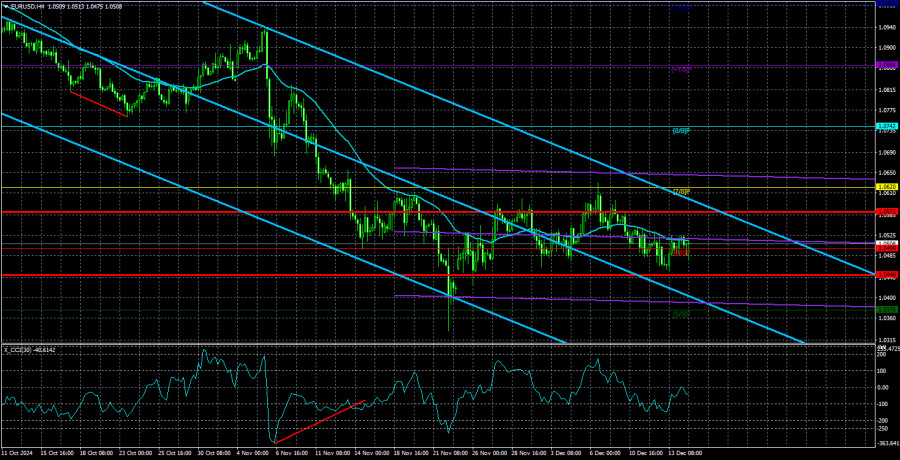
The EUR/USD currency pair continued to trade very calmly on Monday, remaining within the horizontal channel we mention in almost every analysis. It's worth reminding that there are no time limits for how long the price must stay inside a flat range. The pair can continue trading in this mode for another month without issue, regardless of the fundamental and macroeconomic background. Fundamentals and macroeconomics are merely triggers that influence trader sentiment and activity. If the market has no desire to trade or push the pair in a specific direction, no news will help.
At this point, the price remains within a narrow range. This week, expectations are high for a breakout, particularly for the British pound. However, last week's European Central Bank meeting did not affect the flat movement. Therefore, the Federal Reserve meeting might also fail to significantly impact price action.
Currently (while the price is stagnant), the most important factor to remember is that the trend remains downward on the 4-hour, daily, and weekly timeframes. Corrections can last long, while impulsive movements can be rapid. Large players use corrections and consolidations to accumulate positions in a specific direction. Thus, we continue to expect only a decline in the euro. How long we will have to wait for the next downward movement is unknown.
Even the Fed meeting may fail to move the pair. The Fed could lower rates by 0.25%, which is precisely what the market expects. Jerome Powell may again talk about a lack of urgency in easing monetary policy, and that's also what the market expects. If the scenario anticipated by the market materializes, there will be no reason for the market to react. The same applies to other significant events, although there are fewer impactful events for the euro than the pound.
The flat range could end in the coming days but might not conclude in the clear breakout many expect. In other words, we may not see a decisive break below or above the range with a subsequent strong movement. Instead, the pair might gradually drift out of the range. Today, only mid-level reports will be released in the EU and the US. These could support the dollar but may also fail to do so. If the latter happens, the pair will remain within the horizontal channel. A consolidation above the moving average indicates a potential rise to the 1.0600 level. However, there are still no grounds for a medium-term increase in the euro.

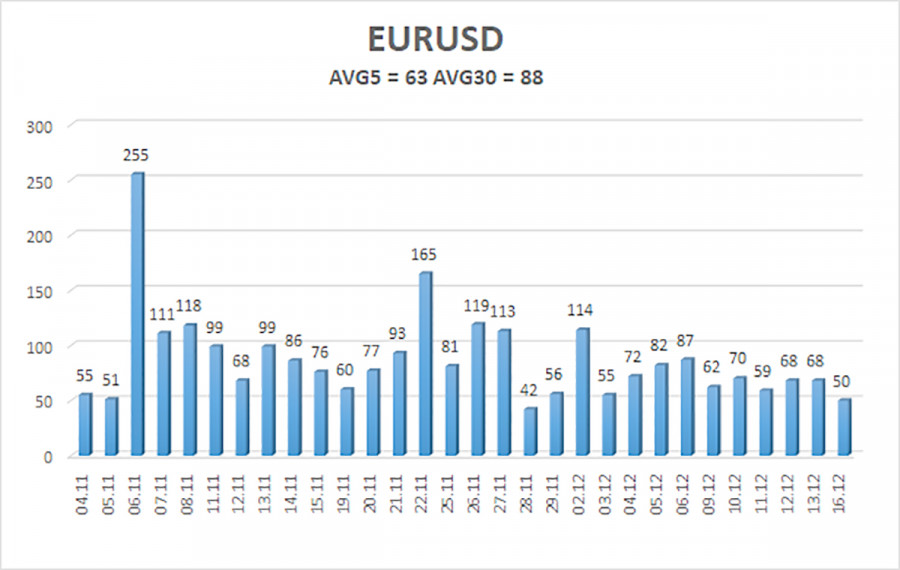
The average volatility of the EUR/USD currency pair over the last five trading days as of December 17 stands at 63 pips, characterized as "average." We expect the pair to move between the levels of 1.0446 and 1.0572 on Tuesday. The higher linear regression channel is directed downward, indicating that the global downward trend remains intact. The CCI indicator has entered the oversold zone several times, triggering a corrective upward movement, which is still ongoing.
Nearest Support Levels:
- S1 – 1.0376
- S2 – 1.0254
- S3 – 1.0132
Nearest Resistance Levels:
- R1 – 1.0498
- R2 – 1.0620
- R3 – 1.0742
Trading Recommendations:
The EUR/USD pair can resume its downward trend at any moment. For several months now, we have been emphasizing our medium-term bearish outlook for the euro, fully supporting the overall downward direction of the trend. There is a high probability that the market has already priced in all or most of the future Fed rate cuts. Therefore, the US dollar still has no reasons for medium-term weakness, even though those reasons were scarce before.
Short positions can be considered with targets at 1.0446 and 1.0376 while the price remains below the moving average. For those trading on "pure technicals," long positions can be considered if the price consolidates above the moving average, with targets at 1.0572 and 1.0620. However, we currently do not recommend long positions. Additionally, the pair has been flat for three weeks.
Explanation of Illustrations:
Linear Regression Channels help determine the current trend. If both channels are aligned, it indicates a strong trend.
Moving Average Line (settings: 20,0, smoothed) defines the short-term trend and guides the trading direction.
Murray Levels act as target levels for movements and corrections.
Volatility Levels (red lines) represent the likely price range for the pair over the next 24 hours based on current volatility readings.
CCI Indicator: If it enters the oversold region (below -250) or overbought region (above +250), it signals an impending trend reversal in the opposite direction.


