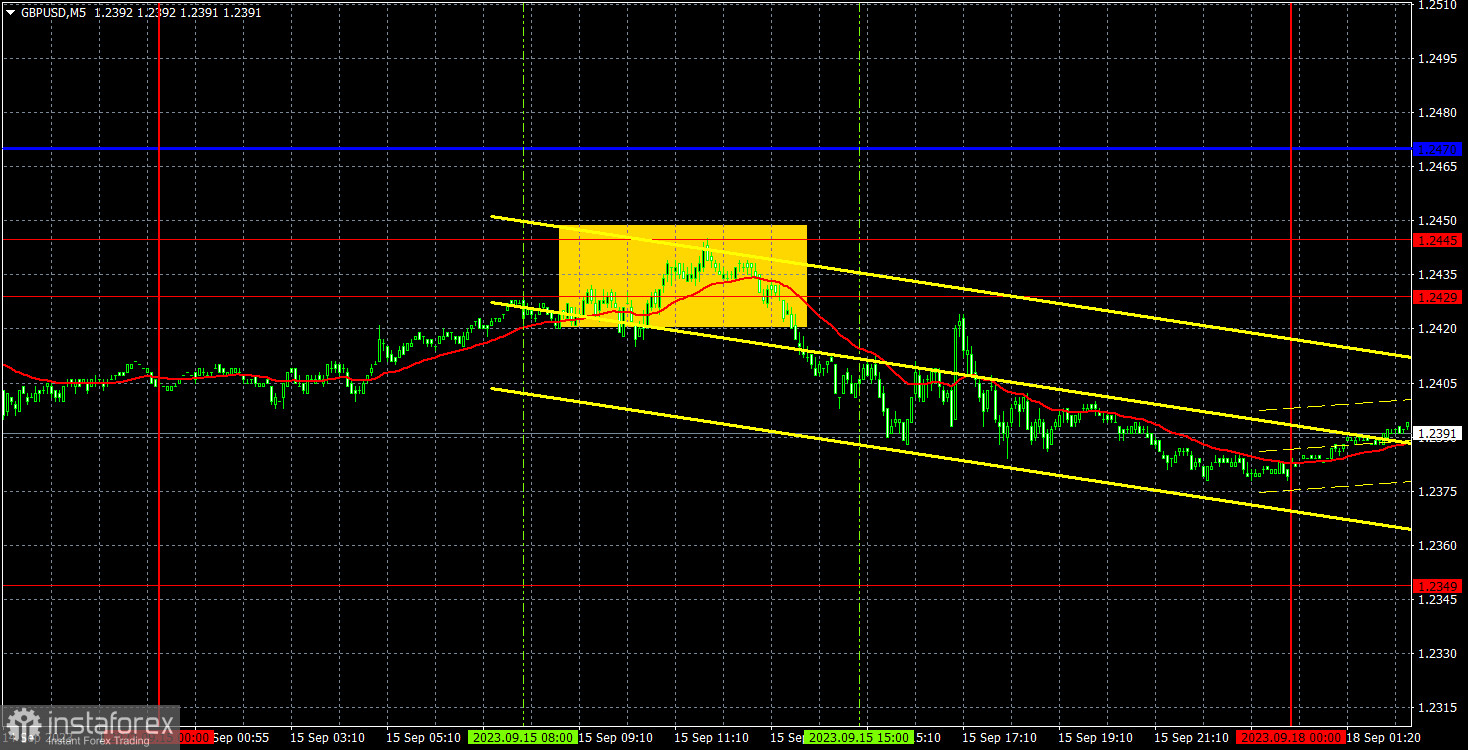
Analysis of GBP/USD 5M
On Friday, GBP/USD tried to correct higher after falling on Thursday. However, it rose to the 1.2429-1.2445 range, from which it rebounded and calmly entered a new freefall. The UK did not release any data, and the US reports had no impact on the pair's movement. As seen in the chart above, there was a slight burst of market emotions at the beginning of the US trading session, and the dollar edged down. However, this 20-30 pip reaction had no impact. As a result, the British pound approaches the meetings of the Bank of England and the Federal Reserve in an unpromising position. Since the pound is falling in anticipation of the meetings, we can say that the market expects a dovish stance from the BoE and a "moderately hawkish" rhetoric from the Federal Reserve. There's also the inflation report in the UK, which can also influence the overall situation.
Only one trading signal was formed on Friday. A rebound from the 1.2429-1.2445 range resulted in a 25-pip drop, and those who had a short position could have gained profit. It's better than nothing. Although, the pound isn't exactly stagnant; there is some minor volatility. However, we are still far from the kind of movements that can yield high profits.
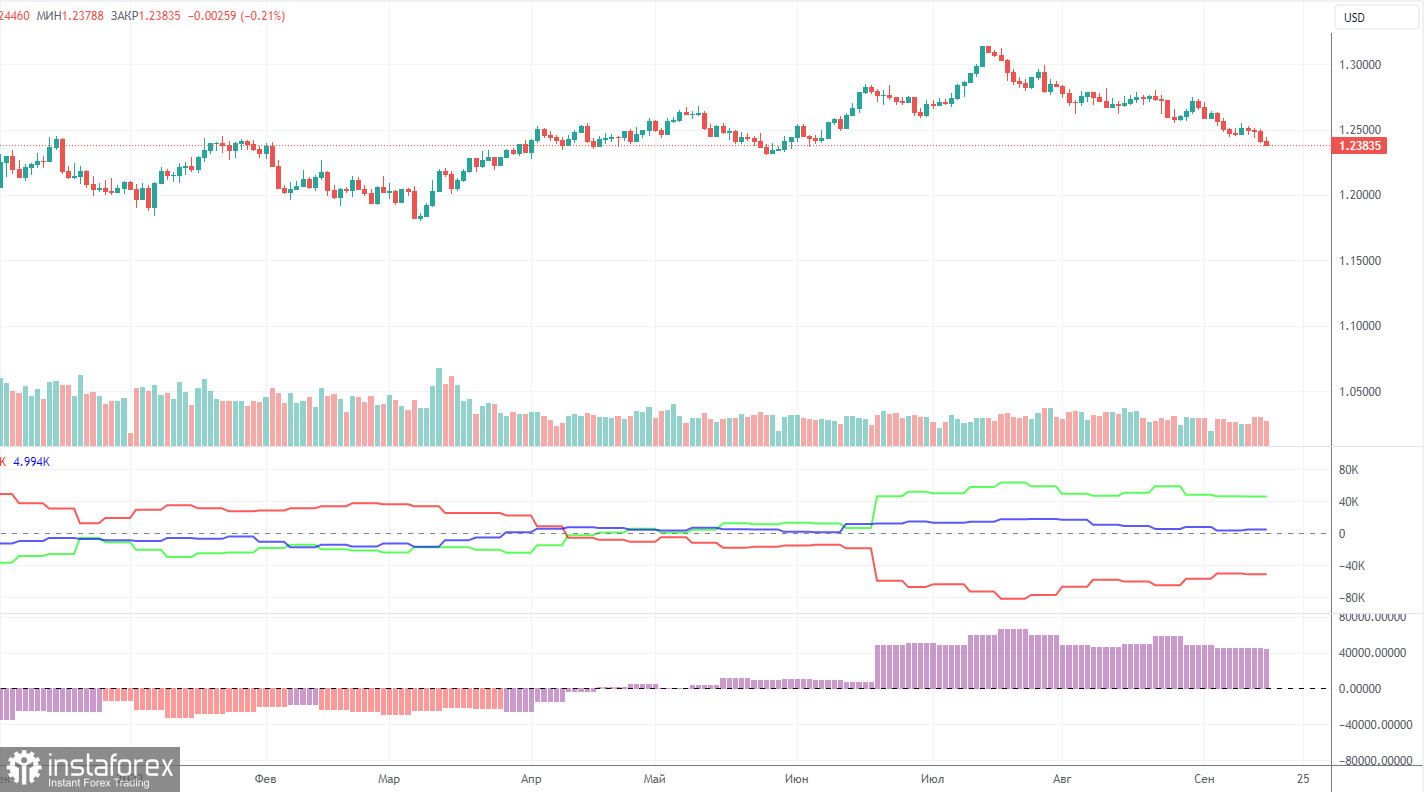
COT report:
According to the latest COT report on GBP/USD, the Non-commercial group opened 4,700 long positions and 4,900 short positions. Thus, the net position of non-commercial traders decreased by 200 contracts over the week. The net position indicator has been steadily increasing over the past 12 months and remains high, while the British pound is still not in a hurry to start a significant downtrend. However, the pound sterling has started to fall in the last two months. If the pound had been rising for a year before, why should it start to fall rapidly now? Perhaps we are at the very beginning of a protracted downtrend.
The British currency has jumped by a total of 2,800 pips from its absolute lows reached last year. All in all, it has been a stunning rally without a strong downward correction. Thus, further growth would be utterly illogical. We're not against the upward trend. We just believe GBP/USD needs a good downward correction first and then assess the factors supporting the dollar and the pound. The Non-commercial group currently holds a total of 97,400 longs and 51,100 shorts. We remain skeptical about the long-term growth of the British currency, as we do not see any fundamental and macroeconomic reasons for it.
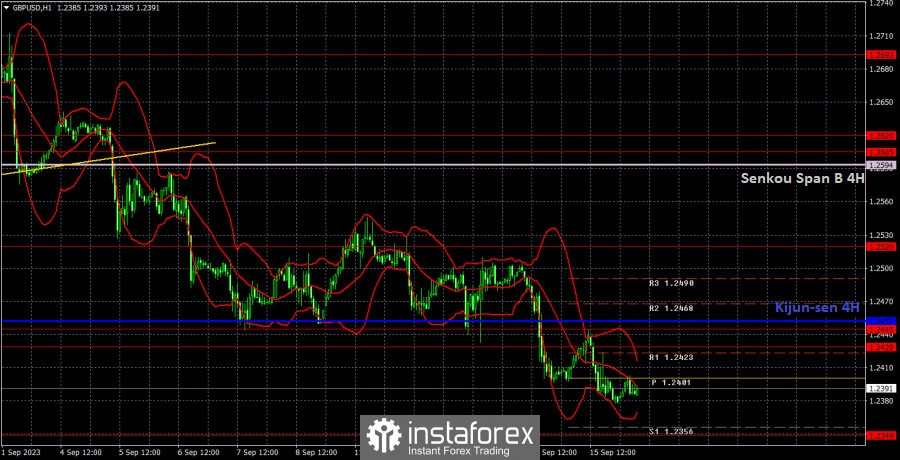
Analysis of GBP/USD 1H
On the 1H chart, GBP/USD continues its downward movement. The pound sterling is still poised to decline and can't correct upwards. Traders are now sitting on the sidelines of the Bank of England and FOMC meetings this week. The British pound may very well sink even lower as the market is currently not interested in the uptrend for obvious reasons.
On September 18, traders should pay attention to the following key levels: 1.2188, 1.2269, 1.2349, 1.2429-1.2445, 1.2520, 1.2605-1.2620, 1.2693, 1.2786, 1.2863. The Senkou Span B (1.2594) and Kijun-sen (1.2452) lines can also be sources of signals, e.g. rebounds and breakout of these levels and lines. It is recommended to set the Stop Loss orders at the breakeven level when the price moves in the right direction by 20 pips. The lines of the Ichimoku indicator can move during the day, which should be taken into account when determining trading signals. There are support and resistance levels that can be used to lock in profits.
On Monday, there are no significant events or reports lined up in the UK and the US. Therefore, we probably won't see active trading or a strong intraday trend. Most likely, sluggish trading will persist, as all the most important events are scheduled for later in the week.
Description of the chart:
Support and resistance levels are thick red lines near which the trend may end. They do not provide trading signals;
The Kijun-sen and Senkou Span B lines are the lines of the Ichimoku indicator, plotted to the 1H timeframe from the 4H one. They provide trading signals;
Extreme levels are thin red lines from which the price bounced earlier. They provide trading signals;
Yellow lines are trend lines, trend channels, and any other technical patterns;
Indicator 1 on the COT charts is the net position size for each category of traders;
Indicator 2 on the COT charts is the net position size for the Non-commercial group.