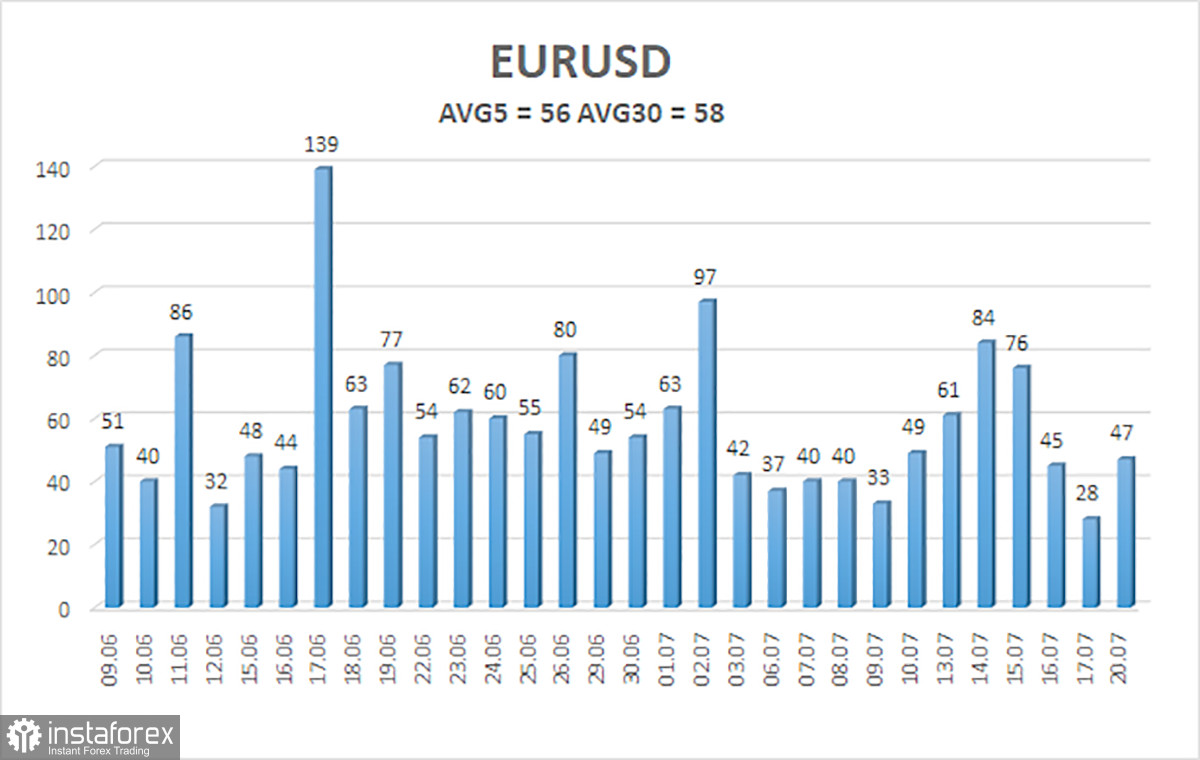
The EUR/USD currency pair moved very modestly on Monday. Overall, such market behavior and pair movement no longer surprise anyone, as we have observed the weakest upward correction for four consecutive weeks that borders on the definition of "flat." The illustration below clearly shows that volatility exceeded 50 pips only three times in the last 12 days. Thus, there is virtually no market movement, no trending movement, and trading makes sense only for very long-term perspectives or for scalping on the smallest timeframes.
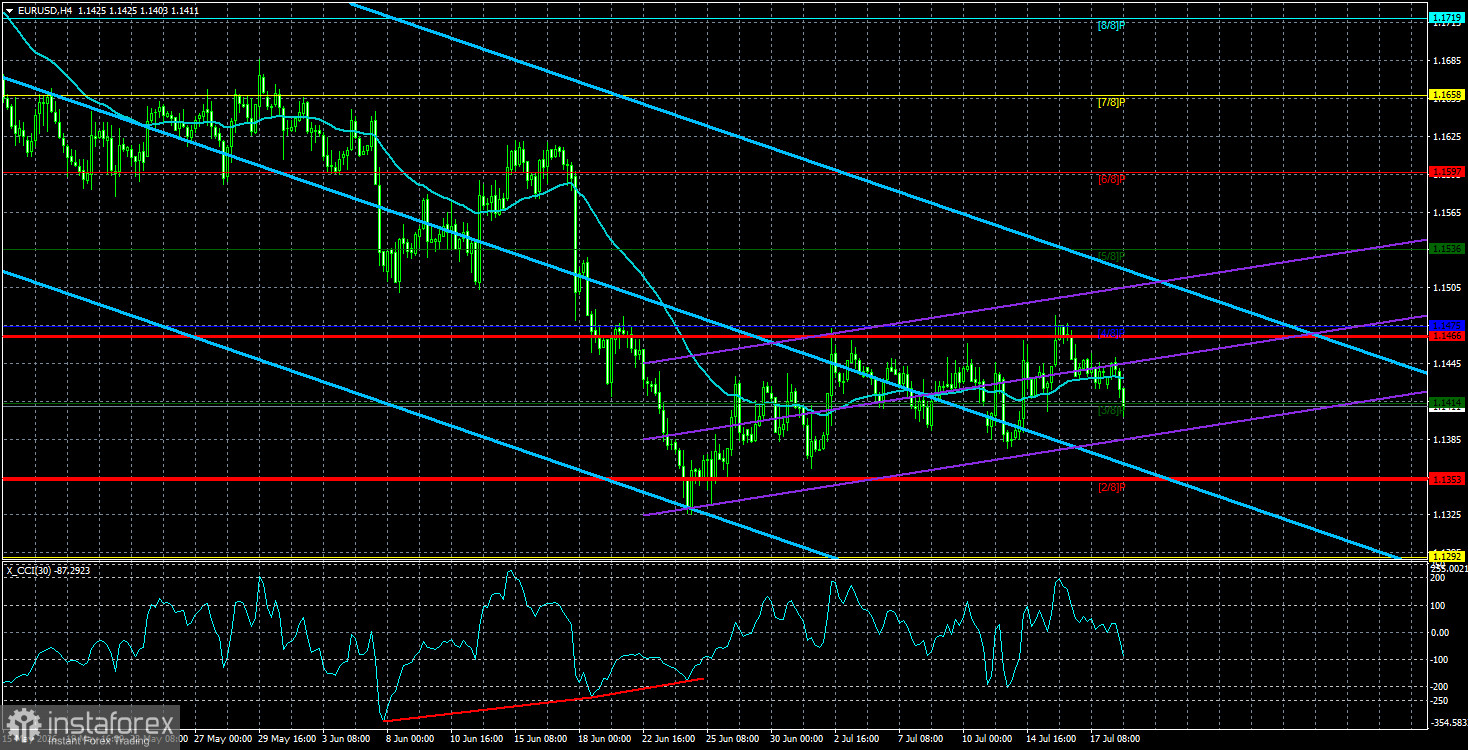
The current strengthening of the European currency still appears as an ordinary correction—so weak it is. Therefore, if we look solely at the character of the pair's movement on the 4-hour timeframe, it seems the market is preparing for a new wave of sell-offs. However, the picture on the weekly timeframe is entirely different. First, the pair has formed a classic three-wave correction, and one does not need to be an analyst to see it. Second, the price is near several recent local lows, which threatens liquidity removal. Third, the global upward trend remains relevant. Fourth, for the past year, the pair has primarily moved sideways. Thus, on the oldest chart, the picture is, conversely, bullish, and the current levels look very attractive for buying.
The main question traders should ask themselves is: what basis does the dollar have for further growth? In 2026, the new year for the American currency began around February when Donald Trump initiated the war against Iran. This factor provided powerful support for the U.S. dollar. If the wars in the Middle East hadn't occurred, the EUR/USD pair would already be trading above $1.20. Recall that a new four-year high was set in January, and most experts predicted yet another challenging year for the dollar.
Now, it's July, and the market is hardly reacting to geopolitical events since every factor has its expiry date. In other words, if the war in the Middle East continues for another year, it is unlikely that the dollar will continue to strengthen over this period. The first months of a geopolitical conflict are a time for capital flight from risky assets, which may be negatively impacted. However, a few months after its onset, capital that wanted to "flee" has done so long ago. Thus, we still do not see grounds for a long-term dollar trend.
This week, there will be a meeting of the European Central Bank, which is both a key and somewhat secondary event. It is key because it is the most significant event by its "headline." It's secondary because the ECB is unlikely to make any important decisions, and the market is willingly ignoring a large part of macroeconomic and fundamental factors right now. Recall that a month and a half ago, the ECB executed tightening monetary policy, which did not resonate with traders. In contrast, the potential interest rate hike by the Fed was reacted to with double the intensity. Therefore, we believe that if the euro begins to rise, it will likely do so regardless of the ECB or other significant events. Look at the rise of the British pound in recent weeks; it began seemingly out of nowhere. The same is likely to occur with the euro.
The average volatility of the EUR/USD currency pair over the last five trading days as of July 21 is 56 pips and is characterized as "average." We anticipate the pair to move between 1.1354 and 1.1466 on Tuesday. The upper channel of the linear regression is directed downward, indicating the continuation of the downward trend. The CCI indicator has entered the oversold area and formed two "bullish" divergences, warning of a possible end to the downward trend.
Nearest support levels:
S1 – 1.1414
S2 – 1.1353
S3 – 1.1292
Nearest resistance levels:
R1 – 1.1475
R2 – 1.1536
R3 – 1.1597
Trading Recommendations:
The EUR/USD pair maintains a downward trend, which is presumably a correction within a global upward trend, as clearly seen on the daily or weekly timeframe. The global fundamental backdrop for the dollar remains negative, but in 2026, first geopolitical factors and then the Federal Reserve's hawkish tone provided strong support for the American currency. When the price is below the moving average, short positions can be considered with targets of 1.1380 and 1.1353. Above the moving average line, long positions are relevant with targets at 1.1466 and 1.1536. The market has been in a flat state for four consecutive weeks.
Explanations for Illustrations:
- Linear regression channels help determine the current trend. If both are directed in the same way, the trend is currently strong.
- The moving average line (settings 20,0, smoothed) determines the short-term trend and direction in which to trade.
- Murray levels are target levels for movements and corrections.
- Volatility levels (red lines) indicate the likely price channel in which the pair will stay for the next day based on current volatility indicators.
- The CCI indicator entering the oversold area (below -250) or the overbought area (above +250) indicates that a trend reversal in the opposite direction is approaching.