To open long positions on EURUSD, you need:
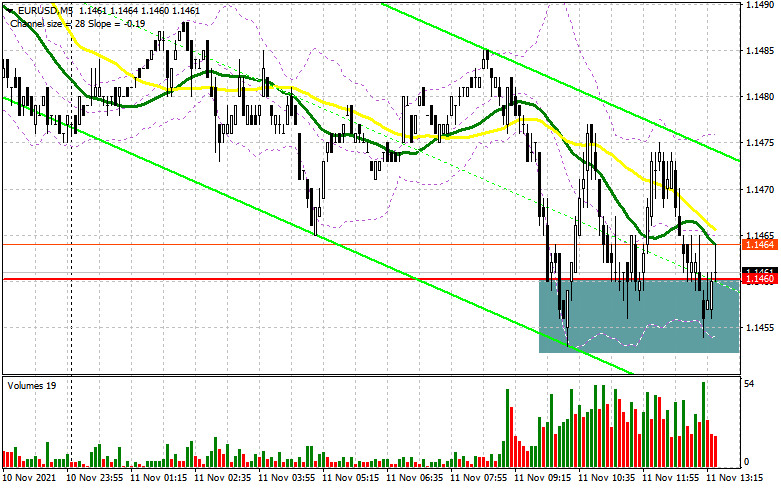
In the first half of the day, euro sellers tried to maintain the pressure that was formed yesterday after the US inflation data. Let's look at the 5-minute chart and figure out what happened. Several unsuccessful attempts to break below 1.1460 led to the formation of a signal to buy the euro against the trend. However, it is quite expected that we did not see a large growth of the pair, and the maximum that we could count on was 15 points. Considering that the technical picture for the second half of the day has not changed much, I advise you to stick to the previous strategy.

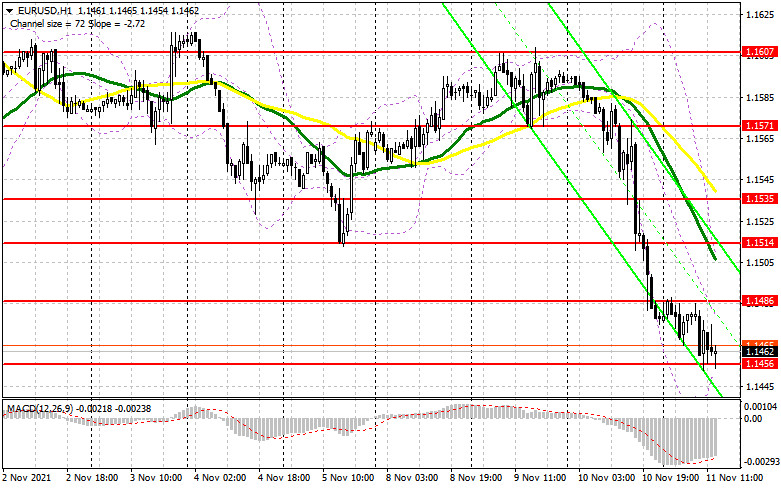
It should be remembered that in the US today is a day off and Veterans Day is celebrated, which will certainly affect the volatility of the pair in the afternoon. Therefore, consider this point when trading. Important fundamental data are also not published, so the pressure on the euro may persist. Of course, having defended the 1.1460 support, the bulls will try to regain control of the market. But to stop a major bearish trend, they need to get beyond 1.1486. Only a reverse test from the top down of this range will give an entry point to long positions based on the growth of EUR/USD in the area of 1.1514, where the moving averages are playing on the sellers' side. This will limit the upward potential of the pair. Only a breakthrough of this range and a top-down test will lead to an additional buy signal and growth to the maximum area of 1.1535, where I recommend fixing the profits. If the pressure on EUR/USD persists in the second half of the day, only the formation of a false breakdown in the area of 1.1456, by analogy with the one we observed from the level of 1.1560 in the first half of the day, will lead to the formation of a signal to open long positions with the aim of an upward correction. In the absence of an activity scenario at 1.1456, it is best to wait for the formation of a false breakdown in the area of 1.1426, but it is possible to open long positions in EUR/USD immediately for a rebound from the minimum of 1.1371, counting on a correction of 15-20 points inside the day.
To open short positions on EURUSD, you need:
Despite the successful attempt to break below 1.1460, the bears continue to control the market, as we did not wait for the active actions of the bulls after the protection of 1.1460 in the first half of the day. Given the low volatility during the American session, it is quite possible that trading will be conducted around the 1.1456 support, the breakthrough of which and the reverse test from the bottom up form a signal to open short positions in the continuation of the downward rally. This will open the way to the lows: 1.1426 and 1.1371. I recommend fixing profits on short positions there. Under the scenario of euro growth during the American session, only the formation of a false breakdown in the area of 1.1486 forms a signal to open new short positions. In the absence of bear activity at this level, I advise you to postpone sales until the test of the next resistance of 1.1514, where the moving averages pass. But even there, it is best to open short positions after the formation of a false breakdown. The best option for selling EUR/USD immediately on a rebound will be a maximum in the area of 1.1535. You can count on a downward correction of 15-20 points.

The COT report (Commitment of Traders) for November 2 recorded a reduction in both short and long positions, which led to a slight recovery of the negative delta, as more sellers left the market than buyers. The meetings of central banks, which last week fueled the markets, did not lead to significant changes, as the specific policy of the Federal Reserve System regarding measures to support the economy allowed investors to remain optimistic and believe in the continuation of the economic recovery. However, expectations that the European Central Bank, despite all its statements, will also be forced to resort to measures to tighten its policy in the near future due to high inflation, leave a chance for buyers of the euro to restore the trading instrument in the medium term. This leads to the fact that with each significant decline in the European currency, the demand for it returns quite actively. In the near future, we will get acquainted with important data on inflation in the United States, which will determine the future direction of the US dollar against several other world currencies. The COT report indicates that long non-commercial positions decreased from the level of 196,880 to the level of 191,496, while short non-commercial positions fell from the level of 208,136 to the level of 197,634. At the end of the week, the total non-commercial net position recovered slightly and amounted to -6,388 against -11,256. The weekly closing price decreased quite slightly, to the level of 1.1599 against 1.1608.
Signals of indicators:
Moving averages
Trading is below 30 and 50 daily moving averages, which indicates the continuation of the bear market.
Note: The period and prices of moving averages are considered by the author on the hourly chart H1 and differ from the general definition of the classic daily moving averages on the daily chart D1.
Bollinger Bands
If the pair grows, the upper limit of the indicator around 1.1514 will act as resistance. A break of the lower limit in the area of 1.1455 will lead to a new sell-off.
Description of indicators
- Moving average (moving average determines the current trend by smoothing out volatility and noise). Period 50. The graph is marked in yellow.
- Moving average (moving average determines the current trend by smoothing out volatility and noise). Period 30. The graph is marked in green.
- MACD indicator (Moving Average Convergence / Divergence - moving average convergence/divergence) Fast EMA period 12. Slow EMA period 26. SMA period 9
- Bollinger Bands (Bollinger Bands). Period 20
- Non-profit speculative traders, such as individual traders, hedge funds, and large institutions that use the futures market for speculative purposes and meet certain requirements.
- Long non-commercial positions represent the total long open position of non-commercial traders.
- Short non-commercial positions represent the total short open position of non-commercial traders.
- Total non-commercial net position is the difference between the short and long positions of non-commercial traders.


