


The world of trading captivates a vast array of traders globally. A simple stroll through the internet reveals advertisements showcasing how effortlessly and swiftly one can generate income in this market.
Indeed, earning is possible, but simplicity and speed are not the characteristics that will pave the way to success in this arena. Numerous traders, upon dipping their toes into trading, end up losing money and becoming forever disheartened in this activity.
To prevent such outcomes, it is imperative to approach trading with astuteness, undergo meticulous preparation, and employ the right methodologies. In this article, we will delve into how to trade on to achieve success.
What is and how it works
An international market where various currencies are traded, is maneuvered by the world's largest banks, brokers, and other financial organizations that engage in the buying and selling of currencies.
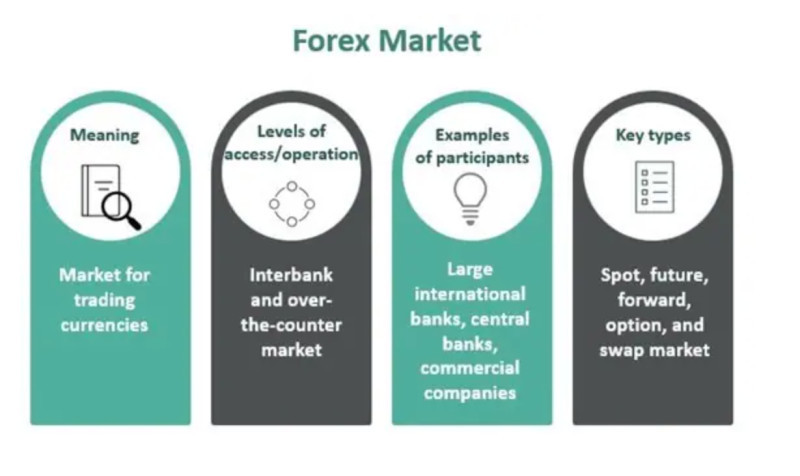
Interestingly, every individual also becomes a participant in this market if they have ever exchanged one currency for another at least once in their life. The very name of this market encapsulates its essence.
Stands as the largest and most liquid market in the world. It is through it that all currency and trade operations are facilitated. The key characteristics of this market include:
- A turnover of more than 5 trillion dollars a day, making this market the largest of all markets.
- The ability to trade around the clock. There are four main trading sessions in different regions, each opening one after the other. This allows transactions to be made 24 hours a day on weekdays.
- Decentralization. This market is not regulated by any central regulator of any country. However, the activities of banking, brokerage, and other organizations are subject to regulation and licensing.
- Sensitivity to both micro and macroeconomic driving forces. Fluctuations in exchange rates are influenced by events in the world of economics and finance within a specific state, as well as the situation in the world as a whole.
- Accessibility. Both private traders and large financial organizations can trade in this market. Moreover, entering the foreign exchange market does not require large initial investments.
- High speed and low cost of transaction execution. Although there are commissions and other fees, they are relatively low. The speed of transactions is enhanced thanks to the development of modern technologies.
Types of contracts
When executing transactions in the market, the term of their fulfillment can vary. There are instances where execution or delivery occurs simultaneously with the transaction, and there are other possibilities for deferred realization of obligations by the parties.
Depending on the delivery terms, several types of contracts are distinguished:
1. Spot contracts are transactions are made on the spot, here and now. The maximum gap between the transaction and delivery can be 1-2 days. Generally, if we're talking about buying currency, it is credited to the account immediately.
Three variants of transaction execution in the spot market are distinguished:
a. TOD (T+0) – "today" – means that the transaction is executed on the same day it is concluded, usually before 23:30 of that day;
b. TOM (T+1) – "tomorrow" – means that the transaction is executed on the day after it is concluded;
c. SPT (T+2) – execution takes place two days later, transactions in the stock market are carried out according to this principle, that is, the purchase of shares;
The first two types are found only in the currency market, and the third one applies to the stock market.
2. Forward is an agreement to purchase or sell an asset in the future at a predetermined cost. This means that in the future, the seller will be obliged to sell the currency, and the buyer to buy it at a pre-agreed rate. The maximum term for such contracts is one year;
3. Futures is an agreement similar to a forward, which also implies a transaction in the future, but with a strictly designated date. A futures contract can be resold to third parties, a forward cannot.
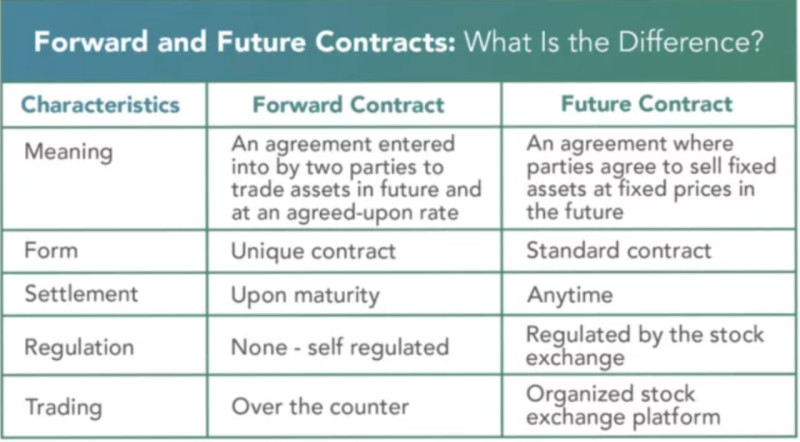
Both forward and futures contracts are concluded at a specified time in the future. However, there are certain differences. Futures contracts are made on an exchange while forward contracts are made over-the-counter (OTC). Besides, futures are standardized while forward contracts can be compiled individually.
Participants
The market sees the participation of a multitude of players, both large and small. Let's delve deeper into who these participants are and the roles they play.
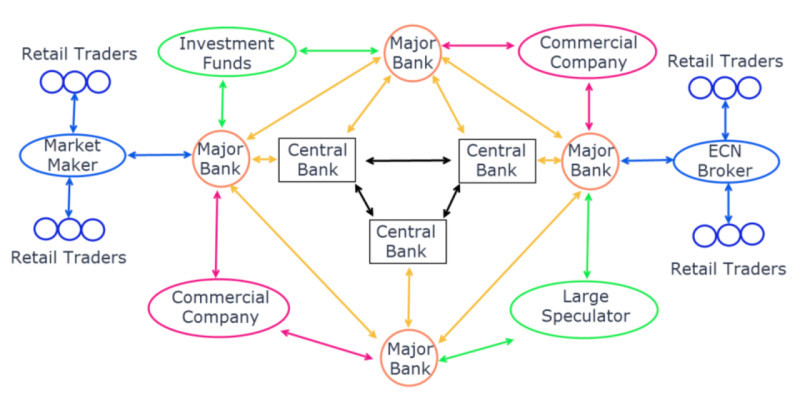
- Banks: Central and Commercial. Central banks exert the most direct influence on the currency market as they regulate currency rates. Commercial banks carry out a vast number of operations, providing their clients with opportunities to buy and sell currencies.
- Companies Engaged in Foreign Trade Activities. Such enterprises include exporters and importers who do not have direct access to the market and conduct all operations through private banks.
- Investment Funds – companies that invest funds in government securities and corporate stocks. Additionally, this category includes international companies that establish joint ventures.
- Brokerage and Dealer Companies performing intermediary functions. They bring together sellers and buyers and allow individual investors and traders to access the market. These companies receive compensation in the form of commissions for their services.
- Private Traders are individuals conducting various operations in the market. This pertains not only to conducting transactions but also to tourist trips, payroll payments by foreign companies, and so forth.
Stock market
The stock market and the market share certain parallels. Both markets facilitate the trading of assets, encompassing sellers and buyers, with the value of trading instruments being determined by the principles of demand and supply.
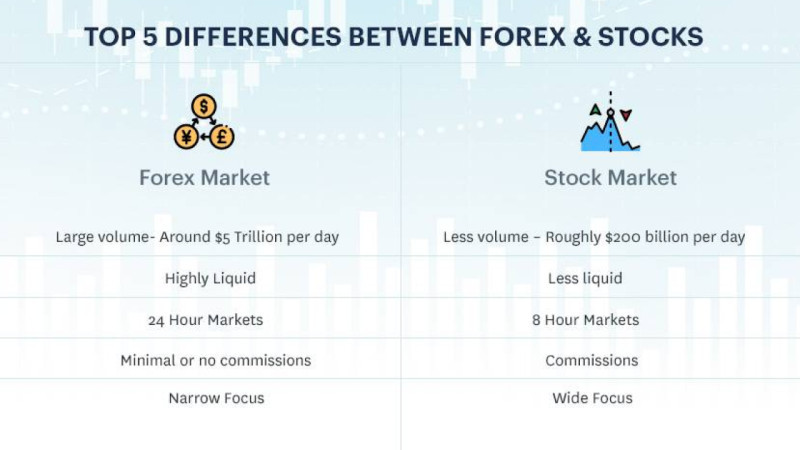
However, these two markets also harbor a series of substantial distinctions. Let’s delve deeper into these differences in the following section:
- Centralization – This emerges as one of the pivotal differences since the stock market involves specific platforms – exchanges – for trading. Conversely, trading on the currency market does not transpire on any centralized platform;
- Leverage. The size of the leverage diverges notably: on the stock exchange, the maximum leverage is 1:10, while on it can be 1:100, 1:500, and even 1:1000;
- Trading Instruments. There are also significant disparities in the assets available for trading: the stock market offers various securities, including stocks, bonds, and other assets, while deals predominantly with currency pairs.
- Trading Time. Trading on the currency market can be conducted around the clock, excluding weekends. On the other hand, trading time on the stock market is confined to the operating hours of a specific exchange.
- Accessibility. In both markets, trading can commence with a modest amount, for instance, $100. However, lots can be fractioned, meaning transactions can be conducted with volumes of 0.01, 0.1 lots, and so forth, while purchasing half or a quarter of a share is not feasible.
- Trading Volume. The trading turnover on surpasses 5 trillion dollars per day, which is approximately 10 times larger than the turnover on the stock market.
How to start trading
To start trading, several mandatory steps should be undertaken. Failing or skipping some of these can significantly increase the likelihood of incurring losses instead of gaining profits.
- Education. The first step involves learning to trade. To successfully engage in trading, understanding how the market operates, mastering the basics of analysis, and key concepts is imperative.
- Choosing a broker. Selecting a brokerage company is a crucial stage. There are numerous criteria to consider when choosing a broker, including regulation, the number of trading instruments, commission sizes, and other parameters.
- Selecting a trading platform. It's vital that the trading platform is as user-friendly, simple, and intuitively understandable. Some brokers have their own trading platforms, while others use universal ones, such as MT4 or MT5.
- Trading on a demo account. A demo account is necessary for acquiring practical trading skills, opening and closing positions, or setting protective orders. It can be viewed as the second stage of learning.
- Opening a real account. Trading can begin with as little as $1, however, it’s important to understand that the potential profit can be influenced by the size of the initial deposit. Typically, traders start with $200-$500.
- Choosing a trading strategy. Randomly executing trades without a strategy is a direct path to deposit loss. Every trader should have specific rules for opening and closing deals, securing profits, and limiting losses. Ideally, the strategy should be developed by the trader themselves.
- Automating the trade. This step can be considered optional, yet it significantly simplifies the trader's work. Trading robots can perform a large portion of routine operations: monitoring market situations, conducting analysis, and selecting the most optimal entry points into a position.
Making trades
Engaging in trading inherently involves a speculative approach. This means that there's no direct purchase or sale of assets taking place; a trader isn’t actually buying specific amounts of currency.
Instead, the trader attempts to predict how the exchange rate of one currency will change relative to another. If their prediction proves accurate, they stand to gain a profit. Within any given pair, there are two currencies: the base and the quoted one.
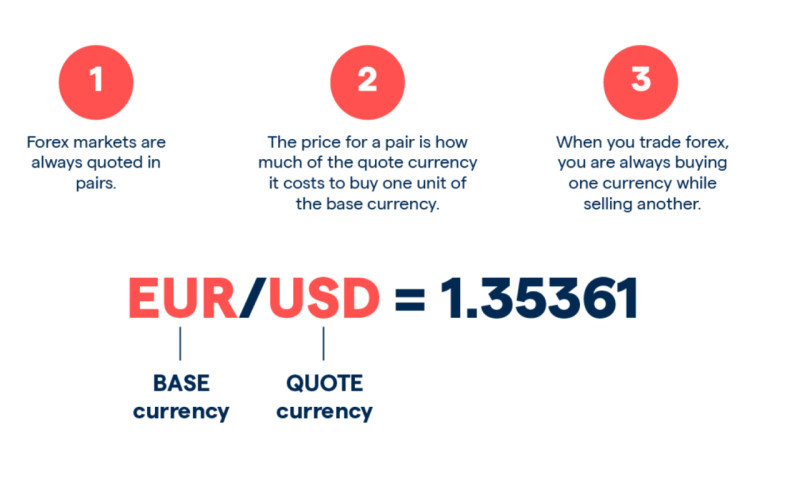
The first currency is utilized as the base, meaning the trader tries to determine how the value of the second currency will change relative to it. Often, the US dollar (USD) is chosen as the base, with the currencies of other countries (JPY, GBP, EUR, etc.) acting as the quoted.
Suppose a trader selects the EURUSD pair and believes that the euro will rise relative to the dollar. Consequently, they open a position to purchase the euro.
If the rate indeed rises, the trader gains profit, the amount of which depends on how much the euro has risen and the size of the bet. This money is credited to their trading account. Conversely, if the euro actually falls, funds are withdrawn from the trader’s account.
It's also vital to distinguish between short and long trades. These terms don't refer to the duration for which positions are opened but rather the essence of the trades. A long trade (long) is a deal to acquire an asset, while a short (short) is a sale.
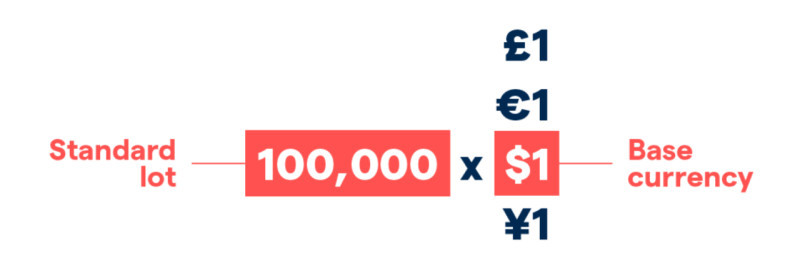
One lot equals 100,000 units of a base currency. It can be $100,000, for example. Naturally, such a large sum is not affordable to every retail trader, so deals of a smaller volume (0.001 or 0.01 lots) are usually made.
Basic strategies
Let's delve deeper into the primary trading strategies that exist. Having a trading algorithm with clear rules is pivotal to achieving success in trading.
Initially, developing your own strategy might be challenging, so utilizing pre-established algorithms can be a viable option. There's a plethora of them available for free, allowing you to select the strategy that suits you best.
In this section, let's explore in more detail the primary strategies available and who they are suitable for. Four main types of trading strategies are distinguished:
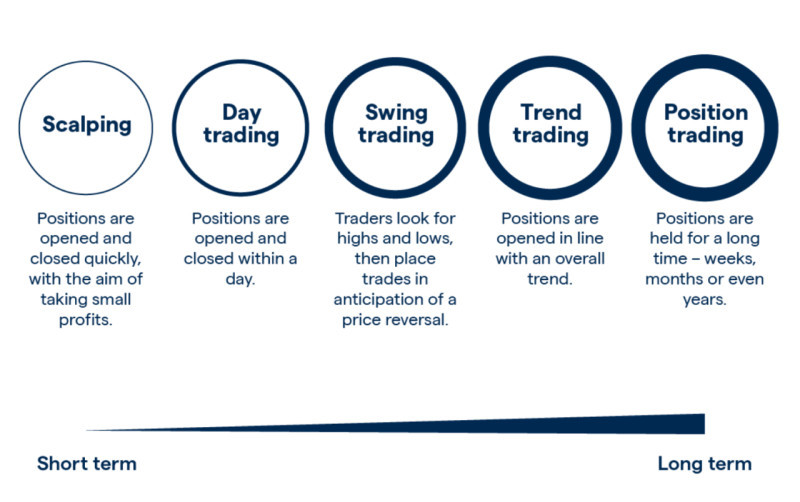
- Scalping involves executing a large number of short-duration trades. Typically, positions are opened for a period ranging from a few seconds to several minutes. While the earnings from each trade tend to be small, the desired profit can be achieved through the volume of trades.
- Intraday trading is performed within a single day, where entry and exit from a position occur within one day, without overnight carryover. This way, one can avoid commissions for transferring trades to the next day and safeguard against unexpected nighttime fluctuations in value.
- Swing trading is the medium-term type, where trades may remain open from several days to several weeks. With this approach, profit of several hundred points can be obtained from a single trade, so there is no need to execute several hundred trades.
- Long-term trading implies keeping positions open for a period ranging from several months to several years. When using such a strategy, there is no need to track every minor fluctuation in asset value. Traders are only interested in long-term changes.
Another classification of strategies
Traders employ trading algorithms that can be classified not only by the number and duration of position holding. Depending on the preferred method of market analysis, they are categorized as:
- Indicator-Based: these are grounded in technical analysis tools. Indicators are overlaid on the chart, and the situation is analyzed based on their readings. Provided the indicators are correctly set, these algorithms can be quite accurate and are easily automated.
- Based on chart analysis: the strategies that are based on the readings of the chart itself without using any additional tools. The price chart movements themselves can form patterns, indicating a possible reversal or continuation of the current trend.
- Based on Japanese Candles: these are part of non-indicator algorithms. Displaying the chart in the form of candles can already provide a wealth of information on its own. Additionally, the candles form specific combinations that signal the trader.
- Based on Wave Analysis: the foundation of these strategies is the idea that the market moves cyclically, meaning its movements repeat over time. Each powerful price movement can be divided into several waves, each of which has a specific significance.
- News-Based: the trading algorithms that are based on tracking the release of the most important news from the world of economics and finance, which can have a serious impact on currency rates. For traders, this is an attempt to profit from strong price fluctuations after news is made public.
Indicator methods
Now that we've explored the various trading strategies, we can delve deeper into the different methods used in market trading. Among indicator strategies, the moving average method holds a special place.
Moving averages are one of the most well-known and frequently used technical indicators. They are utilized both independently and in combination with other analysis tools.
So, what's the essence of this method? It involves averaging the cost of an asset over a specified time period. There are two main ways to calculate the moving average and, consequently, two types of "movings."
The first type is the Simple Moving Average (SMA). Its calculation employs a simple arithmetic mean, meaning the total sum of all asset prices over the chosen time period is divided by the number of time units.
The second type is the Exponential Moving Average (EMA). When calculating it, more weight is given to the more recent price values than to the earlier ones. The formula for its calculation is more complex, however, all calculations are automatically performed by a special program built into the trading terminal.
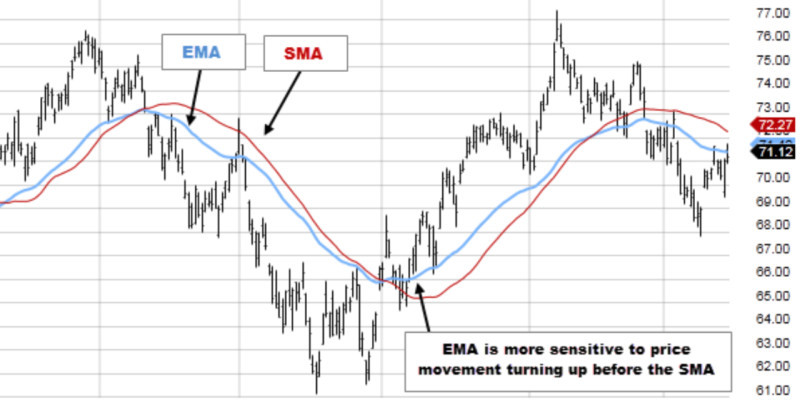
The EMA is considered to be more sensitive to price changes than the SMA. Additionally, the sensitivity of the moving average is also influenced by the period chosen for it.
Moving averages are differentiated into short ones with periods from 5 to 50 and long ones with periods from 100 to 200. Moreover, a period can be understood as either one day or one hour, depending on the chosen timeframe for displaying the chart.
As a general rule, the crossing of moving averages serves as a signal to open positions. If the moving average with a short period crosses the long-term one from below upwards, a position to buy can be opened, and if from above downwards – to sell.
Furthermore, a signal can be obtained when the price chart itself crosses the moving average. If the chart crosses the MA in an upward direction, it's a cue to buy, and if in a downward direction – to sell.
Trading methods
Beyond the method described above, for enthusiasts of using indicator strategies in trading, there are other options. One of them is the Puria Method, which we will delve into more deeply in this section.
This algorithm is quite straightforward in application, as it employs a combination of several classic indicators. It's considered that this methodology doesn’t possess high profitability, but at the same time, it is quite reliable.
Timeframes from M15 to H1, which are relatively low, are utilized for implementation. It is most suitable for intraday trading and scalping, although it can be applied to higher time intervals as well. The most crucial condition for the successful application of this strategy is the presence of a clearly defined trend.
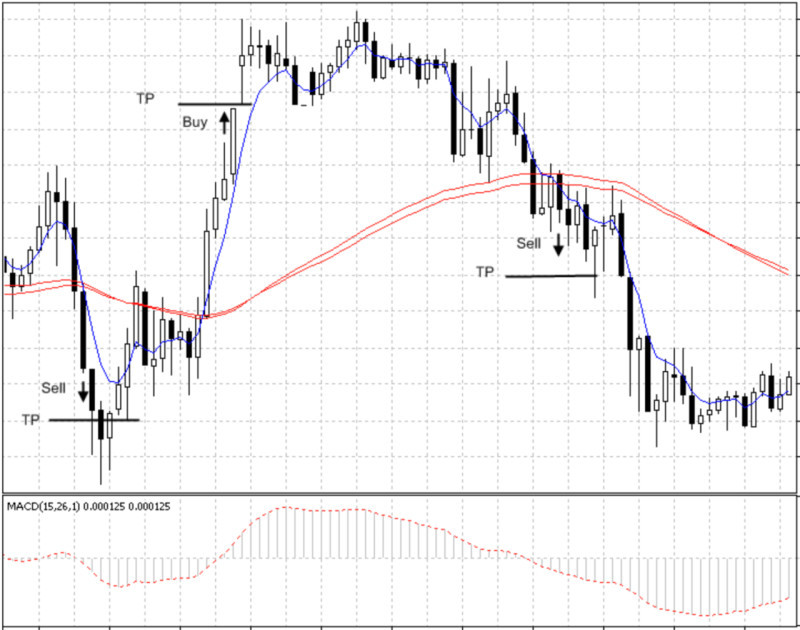
For the purposes of this methodology, a combination of just a few indicators, available in the basic set of any trading platform, is used: MACD and three moving averages.
Two simple moving averages with periods of 75 and 85 and one exponential MA with a period of 5 are utilized. MAs are trend indicators and tend to lag, so the MACD oscillator is added to filter signals.
So, how are trades opened using this method? Buy positions are opened when the EMA is above the two MAs, and the MACD chart is above the zero mark.
Sell positions are opened when the oscillator curve is below the zero mark, and the EMA is below the 75- and 85-period moving averages.
Any currency pair can be traded in this way. Meanwhile, the strategy developers have set a possible size of income in points for each pair. For example, the EURUSD pair can generate a profit of 15 pips, 20 pips for USDCAD, and 10 pips for EURGBP.
Constructing a trend line
Almost any indicator strategy tends to shine when there's a clear directional price movement. To utilize indicators effectively, it's vital to accurately establish a trend line, and that's where the Sperandeo method lends a hand to traders.
Theoretically, crafting trend lines appears pretty straightforward: you simply draw a line through two subsequent extremes. In an upward trend, the line is drawn through two minimum points, while in a downward trend – through two maximums.
However, in practice, it turns out there can be far more local extremes on a chart than just a pair. Consequently, two traders might sketch two distinct trend lines on the very same chart.
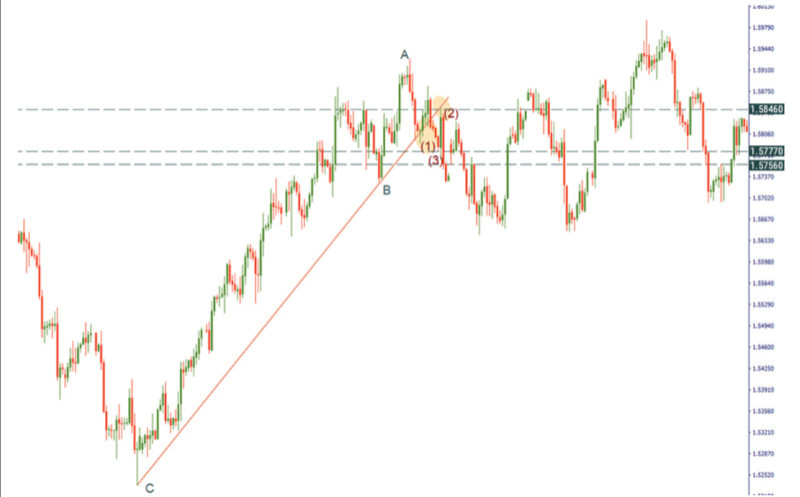
To construct a trend line using the Sperandeo method, a few straightforward steps need to be followed:
- Identify the start of the trend movement and the first extreme (min for an ascending trend and max for a descending one) from which this movement begins (point 1);
- Locate the highest (when constructing a line for an ascending trend) or the lowest (when constructing a line for a descending trend) point;
- Find the extreme (max or min) preceding this: in an upward trend, this will be a local trough, in a downward trend – a local peak (point 2);
- Draw the trend line through the two derived minimums or maximums on the chart (from point 1 to point 2).
A crucial condition for accurately constructing a line using this method is that the price chart should not intersect it. If an intersection occurs, the line needs to be reconstructed.
To do this, point 2 remains unchanged, while point 1 needs to be shifted until a line can be drawn that stays above or below the chart without intersecting it.
Psychological factors
The role of psychological factors in trading is notably substantial. Regardless of the situation, a person remains human and trading is no exception, thus they are vulnerable to the sway of emotions and stress.
The Wyckoff Method involves several principles and theories that elucidate the behavior of market participants. Ultimately, his research enabled him to devise various trading methods and strategies.
So, Wyckoff's theory is grounded on three fundamental rules:
- The Rule of Supply (S) and Demand (D) posits that the value of any asset increases when D surpasses S, and conversely, decreases if S surpasses D. In instances where D and S are equal, the market doesn’t experience significant changes in value.
- The Rule of Cause and Effect, which is closely tied to the first. It explains that an accumulation period precedes and is the cause of the subsequent upward movement in value, while a distribution period is the cause of the subsequent decrease in value and the formation of a downward trend.
- The Rule of Effort versus Result. Actual changes in value should be the outcome of collective efforts, that is, be reflected in trading volumes. When an upward price movement is confirmed by increasing volumes, it indicates the continuation of the upward trend.
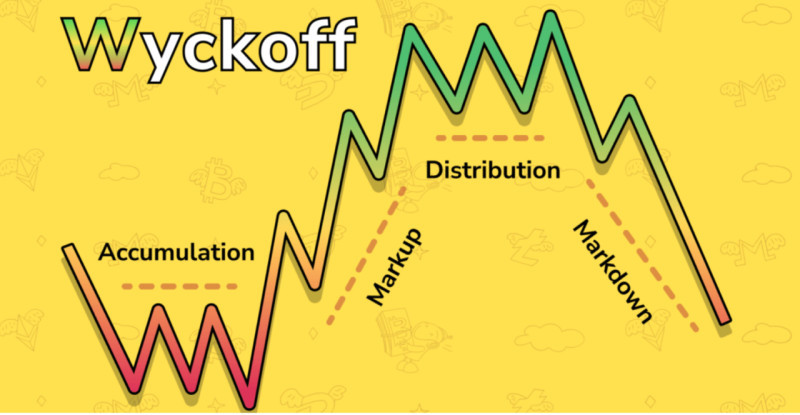
According to Wyckoff's concept, the market goes through specific cycles, which we've mentioned above. The author of the theory distinguishes four cycles:
- Accumulation
- Markup
- Distribution
- Markdown
During the first phase, the market experiences a price movement within a certain range, where energy accumulates for a subsequent strong push. The longer this period lasts, the more potent the movement that follows will be.
Next comes a powerful drive, breaking through one of the range boundaries. The price begins to move towards new peak values, displaying a strong directional movement. This phase witnesses an increase in volumes, making it the prime time to enter the market.
In the third phase, the price seems to hit an invisible ceiling and cannot advance further. Essentially, this stage resembles the first, except that it involves profit-taking, as major players start to close positions. The price moves again within a trading corridor.
In the final stage, the price shows a gradual decline. It's crucial to closely observe the market in this phase to not miss important events. This phase concludes with the onset of the accumulation period.
Other methodologies
Some trading methodologies are somewhat challenging to categorize, as they incorporate several approaches at once. One of the most popular such methodologies is the Hanna`s method.
The most frequently utilized tools in market analysis are the Gann line, fan, and grid. These tools allow for chart marking, which helps identify support and resistance zones and forecast future price movements.
All these tools can be found in the basic set of indicators on the MetaTrader platform, so they can be easily located and added to the chart. Let's delve deeper into each tool, exploring its purpose and how to utilize it in this section.
The Gann line is drawn at a 45-degree angle and is considered by the author to be a long-term trend line. When the chart is positioned above the ascending line, it indicates a prevailing bullish trend.
Conversely, if the line is directed downward and the chart is below it, it signifies the presence of a bearish trend. The chart crossing the line indicates a trend change, which might be a temporary rollback, after which the price will continue moving in the previous direction.
When using the Gann tool, nine lines are drawn on the chart, with the central one at a 45-degree angle. Subsequently, four lines are laid out below and above this line at various angles.
Each of the drawn lines can act as a support or resistance level, depending on the prevailing trend. The central line is considered the strongest, and its crossing usually indicates an impending trend change.
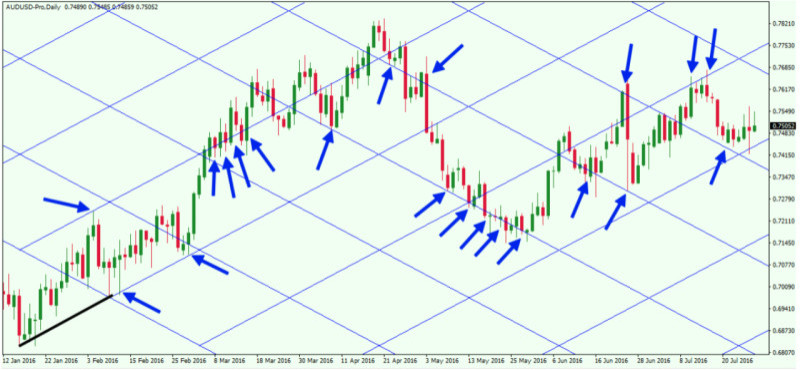
The Gann grid consists of numerous lines that form rhombs. Initially, a central line at a 45-degree angle appears, and then parallel lines are plotted from it at an equal distance.
Advantages and disadvantages
Despite the allure of the market, trading on it has both its positive and negative aspects. Let's first delve into the advantages of this market:
• Size and Liquidity. The largest and most liquid market, with a turnover exceeding 5 trillion dollars every day. Consequently, private traders can find a multitude of opportunities for transactions on this market.
• Global Reach. This market knows no boundaries, allowing private traders and companies worldwide to conduct operations.
• 24/7 Trading Opportunity. Trading is available 24 hours a day due to the existence of four trading sessions, whose operating times seamlessly transition from one to another. As one session closes, another one opens or is already open, enabling continuous trading.
• Wide Selection of Trading Instruments. Trades around 128 currency pairs, from which traders can select those most appealing to them. Some pairs are more popular and are traded more frequently.
• Accessibility. Even beginners, without serious experience and starting capital, can trade in this market. Thanks to the availability of substantial leverage, high income can be achieved even with minimal investments, although this comes with increased risk.
• Low Commission Fees. Trading commissions in the currency market are small, and for some transactions, they are non-existent. This is because intermediary companies primarily profit from the spread, i.e., the difference between the buy and sell prices.
The key drawbacks of trading are:
• High Risks. As mentioned earlier, the large size of leverage is both a plus and a minus. It allows for an increase in the potential income size, but simultaneously, the possible loss size also escalates.
• Decentralization. There is no single central authority regulating this market. Therefore, there's a risk of encountering an unscrupulous counterparty or intermediary company and losing money.
• Manipulations. Large players in can manipulate exchange rates for their benefit at the expense of individual traders. Moreover, numerous factors can influence currency rates, and accounting for all of them can be quite challenging.
Is it possible to earn money?
Considering all the aforementioned characteristics of the market and trading methods, such as the Fibonacci method, for instance, is it really possible to earn and receive a stable income on it? The answer is positive, but there are nuances to consider and rules to adhere to.
The first and most crucial rule to avoid losing money is to work only with reliable intermediaries. Currently, there are a plethora of brokerage companies. However, before initiating collaboration, it is recommended to check whether the company has a license, its work experience, and user reviews.
Unfortunately, even a reliable broker cannot make deals for you. The ability to analyze the market situation and make accurate forecasts will increase a trader's chances of success.
Nevertheless, statistically, only a small percentage of traders achieve success. The majority of users still lose funds and become disillusioned with trading.
There can be numerous reasons for this: insufficient knowledge and experience, inability to control oneself and manage emotions, inability to plan and construct trading strategies, and many other reasons.
To achieve success, one should be pragmatic and not trust online promises about the possibility of earning millions of dollars monthly. Even with a substantial knowledge base and decent experience, earning more than 50% per annum is hardly achievable.
At the same time, the sum that you can earn depends on the initial deposit. Even under favorable conditions, it would be quite hard to profit $10,000 when investing $100.
So, it is important to objectively assess one's abilities. You should invest and risk only the sum that you can afford to lose. The higher potential profits, the higher risks.
Conclusion
In this article, we've explored what the market is, its key features, advantages and disadvantages, as well as strategies and trading methodologies on this market.
The largest and most liquid market, making it attractive for both private traders and large entities: banks, investment funds, and other organizations.
This market operates around the clock on weekdays, however, transactions are conducted without the involvement of any centralized regulatory body. Therefore, there are certain risks associated with fraud, as well as the potential for manipulation by major players.
To achieve success in trading, it's crucial to go through several stages: education, acquiring practical skills, choosing a broker and trading platform, and selecting or developing a trading strategy.
Trading algorithms can be short-, medium-, and long-term. They are also categorized based on the method of market analysis: indicator-based, news-based, based on candlestick analysis, graphical patterns, and so on.
Within each strategy, various trading methods may also be applied. For instance, many strategies utilize a tool such as the moving average.
Various methods for constructing trend lines, support, and resistance levels are also employed. Moreover, psychological factors, which are also vital in trading, must be taken into account.


