Analysis of Thursday's Trades:
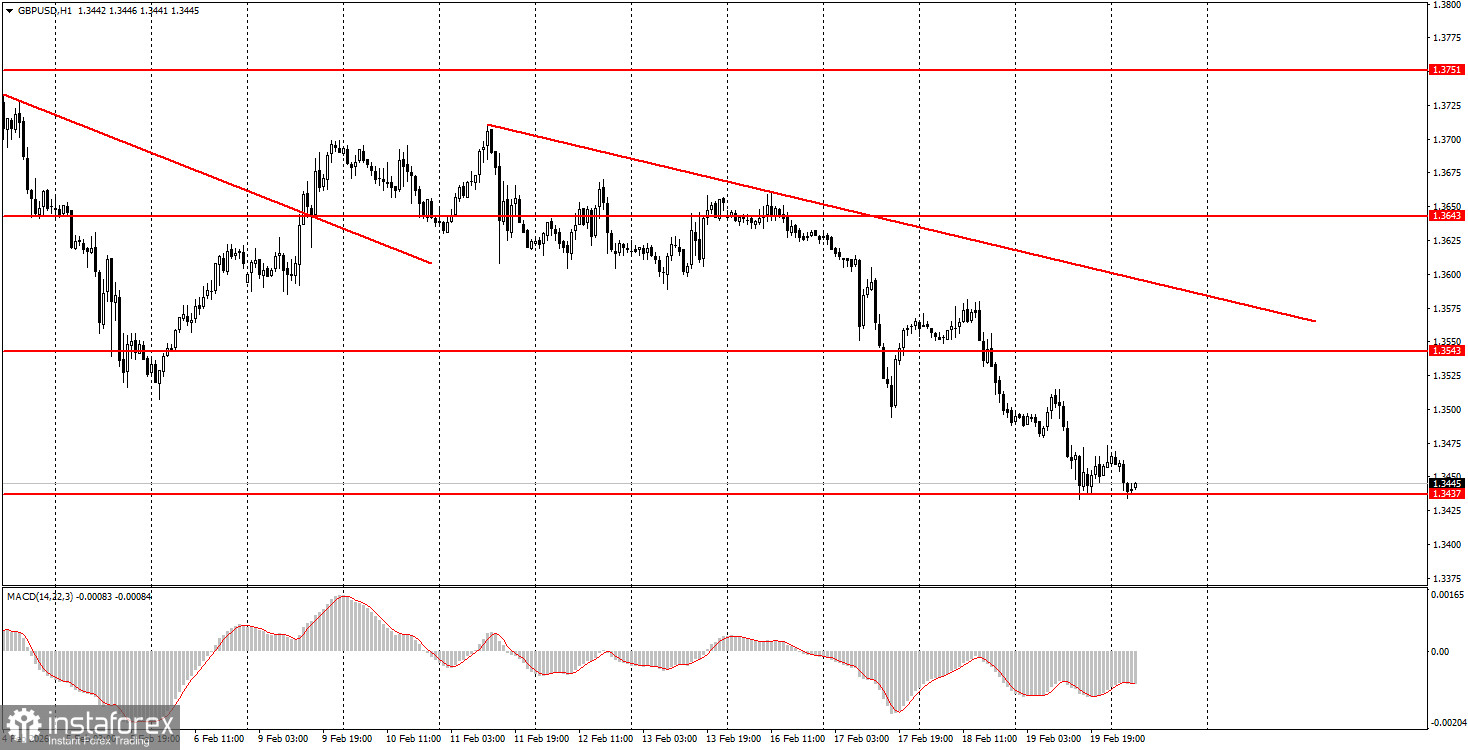
1H Chart of the GBP/USD Pair
The GBP/USD pair continued its downward movement on Thursday, consistent with the current downward trend on the hourly timeframe, but there were no compelling reasons for this. Recall that several important reports occurred in the UK on Tuesday and Wednesday, which exerted pressure on the British currency. However, on Thursday, there were no reports/events/news in either the UK or the US. Therefore, we believe the current decline in the GBP/USD pair does not stem from fundamental or macroeconomic factors. It is essential to remember that market makers execute trades worth billions of dollars, not solely based on macroeconomic data or fundamental events. If any major bank urgently requires tens of billions of dollars and enters the market with purchases, the dollar will rise even if there are no fundamental reasons for it. From our perspective, the current strengthening of the US dollar can only be explained as another correction and is weakly supported by the macroeconomic backdrop.
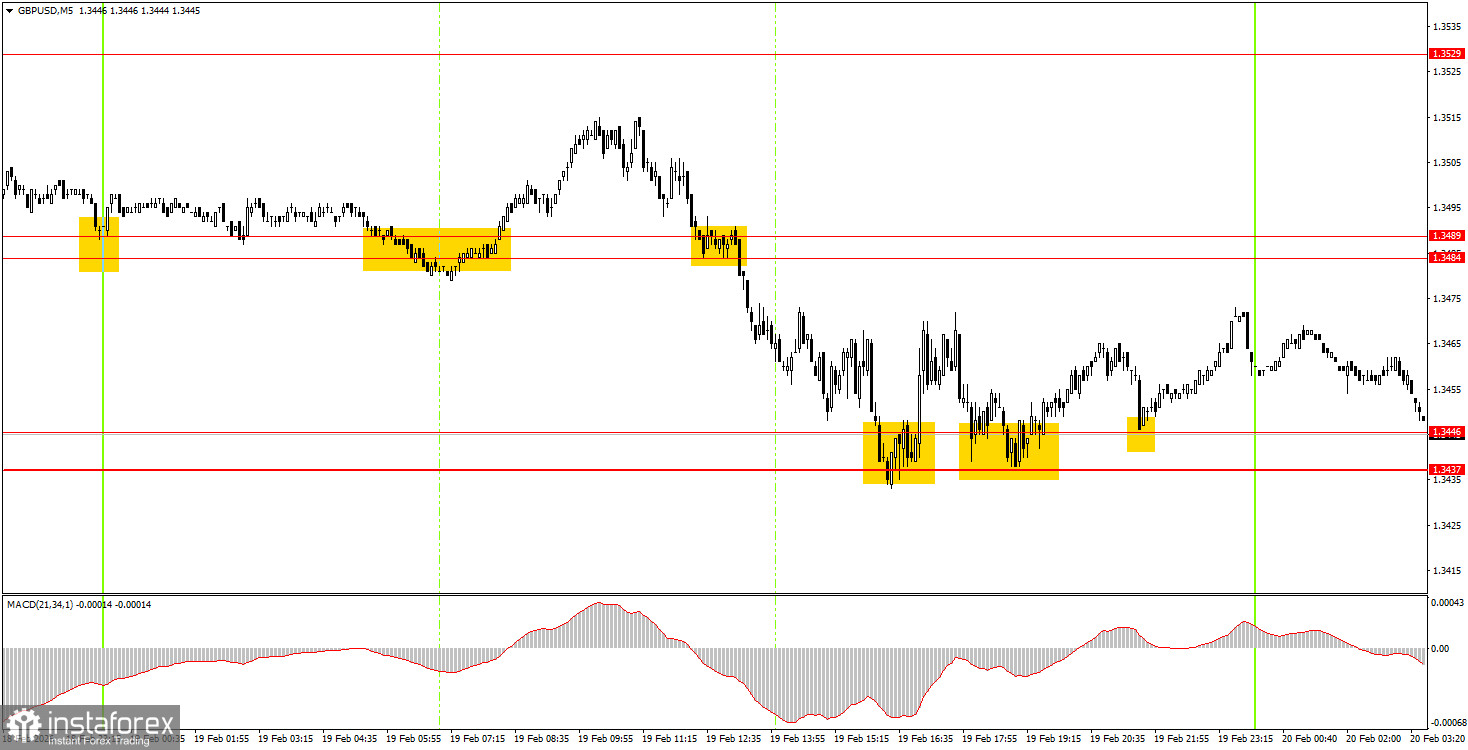
5M Chart of the GBP/USD Pair
On the 5-minute timeframe, several signals were generated on Thursday. During the European trading session, the price bounced off the 1.3484-1.3489 area but failed to reach the nearest target. This was followed by a sell signal in the same area, after which the target area of 1.3437-1.3446 was reached. Three price bounces from this area allowed beginner traders to open long positions, but the target was not achieved. Thus, all trades, except one, closed at breakeven via Stop Loss, while one closed in profit.
How to Trade on Friday:
On the hourly timeframe, the GBP/USD pair has broken the downward trend and... formed a new one. There are no global reasons for medium-term dollar growth, which is why we expect the global upward trend to continue from 2025, potentially pushing the pair to a low of 1.4000. In recent weeks, the situation has often not favored the British currency, which explains the somewhat unexpected decline of the pound.
On Friday, beginner traders can consider opening long positions if the pair rebounds from the 1.3437-1.3446 area, targeting 1.3484-1.3489. A price settlement below the area of 1.3437-1.3446 would allow for new short positions with a target of 1.3403-1.3407.
On the 5-minute timeframe, the following levels can be traded: 1.3319-1.3331, 1.3365, 1.3403-1.3407, 1.3437-1.3446, 1.3484-1.3489, 1.3529-1.3543, 1.3643-1.3652, 1.3695, 1.3741-1.3751, 1.3814-1.3832, 1.3891-1.3912, 1.3975. On Friday, the UK will publish the retail sales report and indices of business activity in the services and manufacturing sectors. In the US, the data will again not be the most critical, but the PCE index can be highlighted. We believe that today, British data will have the greatest impact.
Main Rules of the Trading System:
- The strength of the signal is determined by the time it takes to form (rebound or breaking through the level). The shorter the time, the stronger the signal.
- If two or more trades were opened around a particular level based on false signals, all subsequent signals from that level should be ignored.
- In a flat market, any pair can generate numerous false signals or no signals at all. In any case, it is best to stop trading at the first signs of a flat.
- Trades are opened during the time period between the start of the European session and until the middle of the American session, after which all trades should be manually closed.
- On the hourly timeframe, signals from the MACD indicator should ideally be traded only when there is good volatility and a trend confirmed by a trend line or channel.
- If two levels are too close to each other (ranging from 5 to 20 pips), they should be considered as a support or resistance area.
- After moving 20 pips in the correct direction, it is advisable to set the Stop Loss to break-even.
What's on the Charts:
- Support and resistance levels are targets for opening buy or sell trades. Take Profit levels can be placed around them.
- Red lines indicate channels or trend lines that reflect the current trend and indicate the preferred direction for trading now.
- The MACD indicator (14,22,3) – the histogram and signal line – serves as a supplementary indicator that can also be used as a source of signals.
- Important speeches and reports (always found in the news calendar) can significantly influence the movement of the currency pair. Therefore, during their release, trading should be conducted with maximum caution, or it is advised to exit the market to avoid a sharp price reversal against the preceding movement.
- Beginners trading in the Forex market should remember that not every trade can be profitable. Developing a clear strategy and practicing sound money management are the keys to long-term trading success.