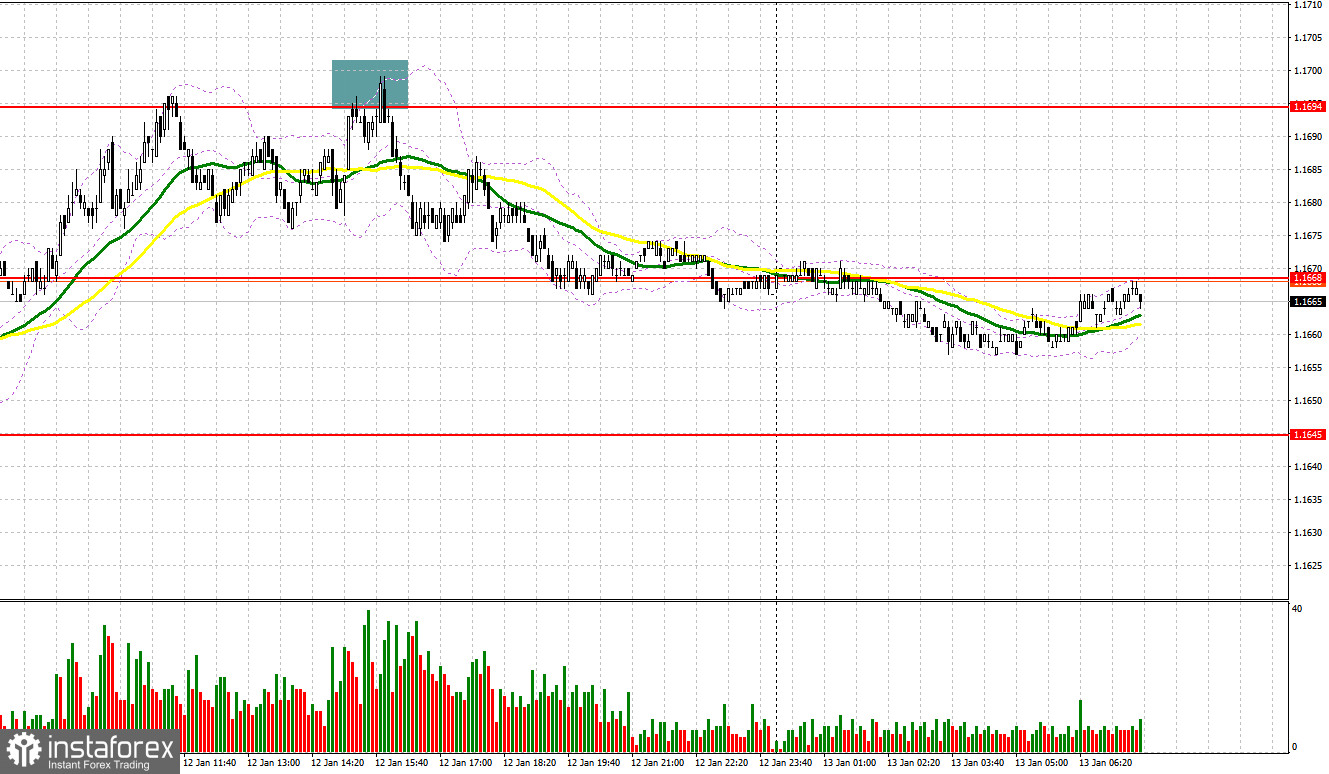
Yesterday, several entry points into the market were formed. Let's look at the 5-minute chart and figure out what happened there. In my morning forecast, I highlighted the 1.1681 level and planned to make entry decisions based on it. The rise and formation of a false breakout around 1.1681 provided a sell entry for the euro, but it did not lead to a major decline in the pair. In the second half of the day, sellers' active actions, already around 1.1694, led to another euro sale, driving the pair down 30 pips.
For opening long positions on EURUSD, it is required:
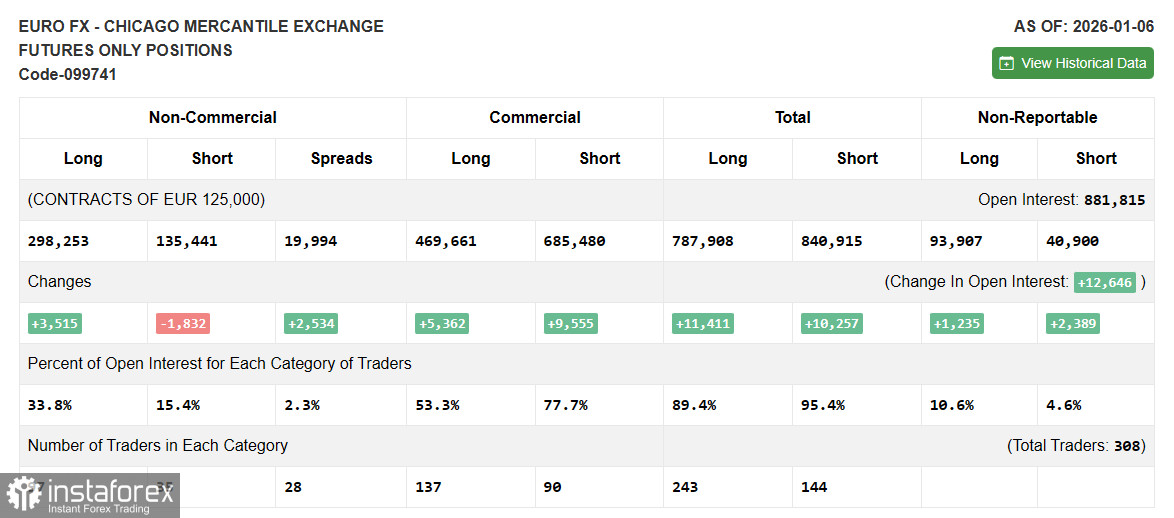
Before talking about further prospects for EUR/USD movement, let's look at what happened on the futures market and how Commitment of Traders positions changed. In the COT report (Commitment of Traders) for January 6, there was an increase in long positions and a reduction in shorts. Expectations of a pause in the Federal Reserve's rate-cutting cycle do not help the US dollar to strengthen. The main reason is the difficulties the Federal Reserve has begun encountering again, and the pressure exerted on it by the Trump administration. Until this issue is fully resolved, traders will prefer risk assets. The COT report indicates that non-commercial long positions increased by 3,515 to 298,253, while non-commercial short positions decreased by 1,832 to 135,441. As a result, the spread between long and short positions increased by 2,534.
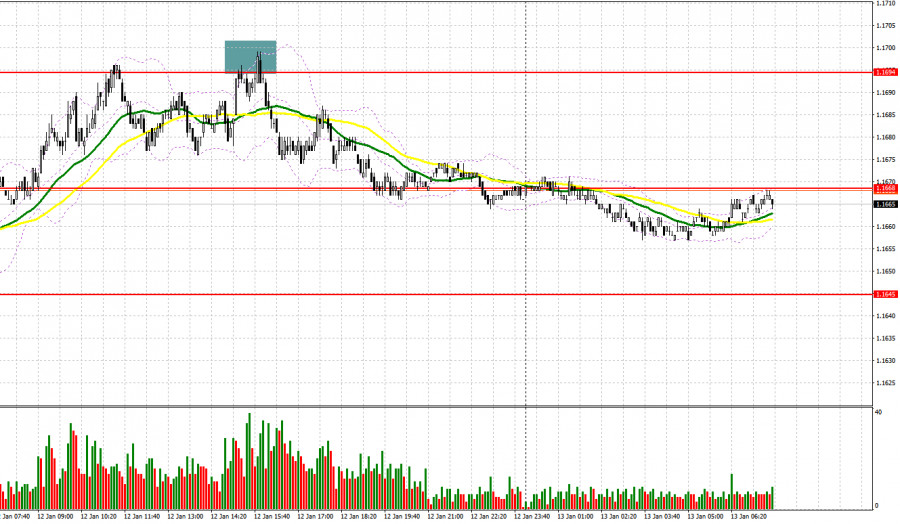
Today, in the first half of the day, there is no eurozone data. No public statements by European politicians are scheduled either, so the market may remain on the side of dollar buyers. With a small return of pressure on the euro, I expect the first buyer reaction around 1.1646. Only the formation of a false breakout will provide an entry point into the market, with a target to rise to the resistance at 1.1672, formed yesterday. A breakout and a retest of this range would confirm the correct action to buy the euro, aiming for a larger rise in the pair to 1.1697, which would indicate buyers regaining initiative. The farthest target will be the 1.1717 area, where I will take profits. If EUR/USD falls and there is no activity around 1.1646, pressure on the pair may return. Sellers will likely be able to reach the more interesting level 1.1619. Only if the formation of a false breakout forms will there be a suitable condition to buy the euro. Opening long positions immediately on the rebound will be from 1.1591 with a target of a 30–35 pip intraday upward correction.
For opening short positions on EURUSD, it is required:
Sellers did everything they could yesterday to stop the euro's bull market, and it seems they succeeded. Today, the main task will be defending the resistance at 1.1672, where the moving averages cross. Only the formation of a false breakout will be a reason to sell, targeting a decline to support at 1.1646. A breakout and consolidation below this range, as well as a retest from below to above, will be another suitable option to open short positions with a move toward 1.1619, which would return a bearish character to the market. The farthest target will be the 1.1591 area, where I will take profits. If EUR/USD moves up in the first half of the day and there is no active bear action around 1.1672, short positions are best postponed until the next resistance at 1.1697. Sell there only after a failed consolidation. I plan to open short positions immediately on the rebound from 1.1717, targeting a 30–35 pip downward correction.
Indicator signals
Moving averages
Trading is conducted around the 30- and 50-day moving averages, indicating market uncertainty.
Note: the period and price basis of the moving averages are considered by the author on the hourly H1 chart and differ from the classical daily moving averages on the D1 chart.
Bollinger Bands
In the event of a decline, support will be provided by the indicator's lower band at around 1.1655. In case of a rise, the upper band will act as resistance around 1.1695.
Indicator descriptions
- Moving average — smooths volatility and noise to determine the current trend. Period — 50. Marked in yellow on the chart.
- Moving average — smooths volatility and noise to determine the current trend. Period — 30. Marked in green on the chart.
- MACD (Moving Average Convergence/Divergence) — fast EMA period 12, slow EMA period 26, signal SMA period 9.
- Bollinger Bands — period 20.
- Non-commercial traders — speculators such as retail traders, hedge funds, and large institutions using the futures market for speculative purposes and meeting certain criteria.
- Non-commercial long positions — the total long open position of non-commercial traders.
- Non-commercial short positions — the total short open position of non-commercial traders.
- Net non-commercial position — the difference between non-commercial long and short positions.