empty
14.09.2023 01:59 PM
EUR/USD and GBP/USD: Technical analysis for September 14

EUR/USD

This image is no longer relevant

Higher Timeframes

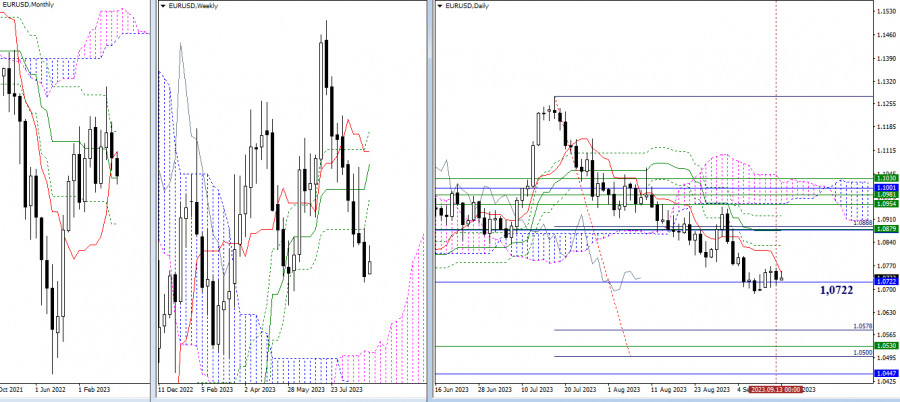
The situation has remained virtually unchanged for the past day. The daily consolidation with the center of attraction at 1.0722 (monthly medium-term trend) persists. The daily short-term trend has descended into the consolidation zone (1.0748). Other reference points mentioned earlier remain in place. For bullish players, the most important area during an upward trend will be the region between 1.0875–79 (daily medium-term trend + monthly short-term trend + weekly Fibonacci Kijun), with intermediate resistance at 1.0830 (daily Fibonacci Kijun). For bearish players after the correction is completed, the support zone is of interest, including the daily target for breaking the Ichimoku cloud (1.0500 - 1.0578), the upper boundary of the weekly cloud (1.0530), and the final level of the monthly Ichimoku cross (1.0447).

This image is no longer relevant

H4 - H1

On lower timeframes, the situation continues to be restrained by the weekly long-term trend (1.0727), which is currently almost horizontal. These circumstances indicate ongoing uncertainty in the movement's development, as confirmed by the daily consolidation. The classic pivot points serve as references for intraday movement development. For bullish players, the important resistances are 1.0759 - 1.0788 - 1.0812, while for bearish players, the supports that may come in handy are 1.0706 - 1.0682 - 1.0653.

***

GBP/USD

This image is no longer relevant

Higher Timeframes

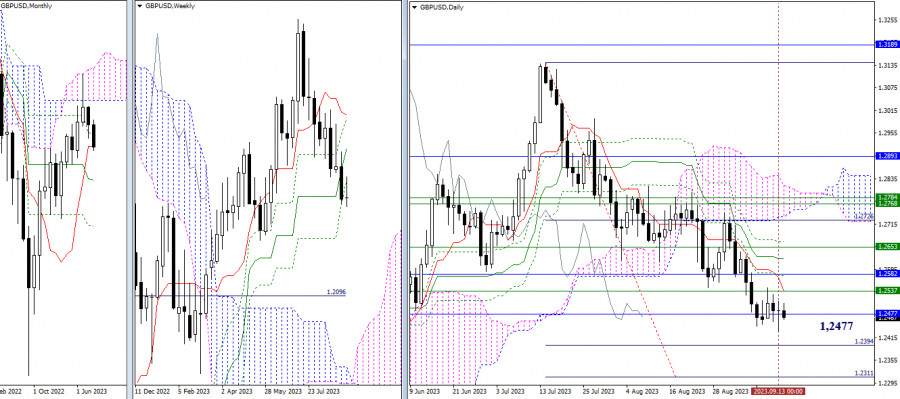
The attraction and influence of the monthly short-term trend (1.2477) continue to restrain market activity, so the main conclusions and expectations remain the same. It is worth noting that the location of the target reference points is also unchanged. Thus, in the event of increasing bearish sentiment, attention will be directed to achieving the daily target for breaking the Ichimoku cloud (1.2394 - 1.2311), and in the case of bullish activity, it will be crucial to pass through 1.2537 - 1.2582 (weekly and monthly Fibonacci Kijun + daily short-term trend).

This image is no longer relevant

H4 - H1

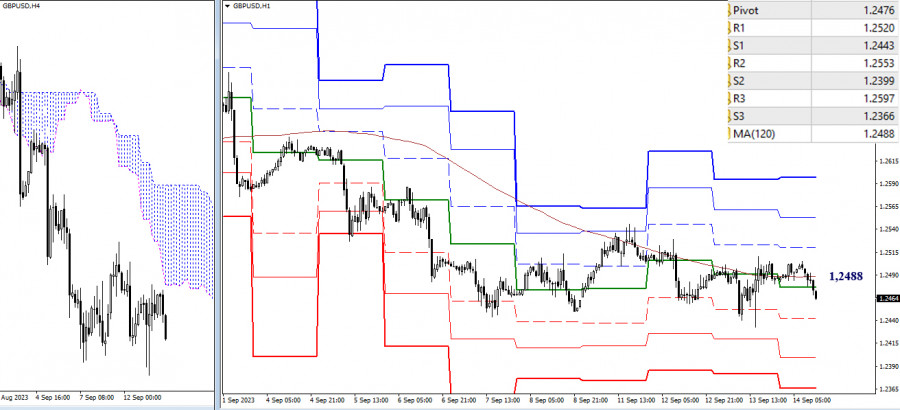
On lower timeframes, the situation has not changed. The weekly long-term trend (1.2488) continues to restrain movement development, and the market remains within its attraction and influence zone. If the situation changes within the day, the classic pivot points (1.2443 - 1.2399 - 1.2366) will be significant for the bearish players, while the resistances of the classic pivot points (1.2520 - 1.2553 - 1.2597) will be significant for the bulls.

***

The technical analysis of the situation uses:

Higher timeframes - Ichimoku Kinko Hyo (9.26.52) + Fibo Kijun levels

Lower timeframes - H1 - Pivot Points (classic) + Moving Average 120 (weekly long-term trend)

Evangelos Poulakis,
Analytical expert of InstaForex
© 2007-2025
Select timeframe
5
min
15
min
30
min
1
hour
4
hours
1
day
1
week
Earn on cryptocurrency rate changes with InstaForex
Download MetaTrader 4 and open your first trade
  • Grand Choice
    Contest by
    InstaForex
    InstaForex always strives to help you
    fulfill your biggest dreams.
    JOIN CONTEST

Recommended Stories

Trading Signals for GOLD (XAU/USD) for April 14-17, 2024: sell below $3,224 (+1/8 Murray - 21 SMA)

Our trading plan for the coming hours is to sell gold below 3,224, with targets at 3,203 and 3,156. We should be alert to any technical rebound, as the outlook

Dimitrios Zappas 15:59 2025-04-14 UTC+2

Forecast for EUR/USD on April 14, 2025

On Friday, the EUR/USD pair continued to rise but pulled back in the second half of the day. The decline (i.e., dollar strengthening) was short-lived

Samir Klishi 12:28 2025-04-14 UTC+2

Forecast for GBP/USD on April 14, 2025

On the hourly chart, the GBP/USD pair continued its upward movement on Friday and today is on track to reach the 1.3151 level. A bounce from this level will favor

Samir Klishi 12:25 2025-04-14 UTC+2

Technical Analysis of Intraday Price Movement of Crude Oil Commodity Instrument, Monday April 24, 2025.

On the 4-hour chart of the Crude Oil commodity instrument, the Inverted Head & Shoulders pattern and Bullish Pattern 123 and Divergence between the #CL price movement and the Stochastic

Arief Makmur 07:19 2025-04-14 UTC+2

Technical Analysis of Intraday Price Movement of Palladium vs USD Commodity Instrument, Monday April 24, 2025.

With the appearance of Divergence from the Stochastic Oscillator indicator with the XPD/USD price movement on its 4-hour chart and the appearance of a Bullish 123 pattern followed

Arief Makmur 07:19 2025-04-14 UTC+2

#SPX – Summary and Outlook

Last week, even though there was a bearish gap, bullish players were able to reclaim their ground effectively. The market is now approaching the point where it may eliminate

Evangelos Poulakis 00:58 2025-04-14 UTC+2

Trading Signals for EUR/USD for April 11-15, 2025: sell below 1.1470 (+2/8 Murray - overbought)

During the European session, the euro reached a new high around +2/8 Murray, located at 1.1473. This movement in EUR/USD occurred after the announcement by China's Ministry of Finance that

Dimitrios Zappas 16:44 2025-04-11 UTC+2

Trading Signals for GOLD (XAU/USD) for April 11-13, 2025: sell below $3,235 (+1/8 Murray - overbought)

Early in the American session, gold is undergoing a strong technical correction after reaching a new high around 3,237.69 for now. Economic data from the United States will be released

Dimitrios Zappas 16:04 2025-04-11 UTC+2

EUR/USD – April 11th. The Dollar's Decline Shows No Sign of Stopping

On Thursday, the EUR/USD pair spent the entire day in an upward move, gaining 400 points and approaching the 261.8% Fibonacci corrective level at 1.1318. A rebound from this level

Samir Klishi 12:36 2025-04-11 UTC+2

Forecast for GBP/USD on April 11, 2025

On the hourly chart, the GBP/USD pair continued its upward movement on Thursday and secured a position above the 127.2% corrective level at 1.3003 – by Friday morning. This suggests

Samir Klishi 12:32 2025-04-11 UTC+2
Can't speak right now?
Ask your question in the chat.
Widget callback
 

Dear visitor,

Your IP address shows that you are currently located in the USA. If you are a resident of the United States, you are prohibited from using the services of InstaFintech Group including online trading, online transfers, deposit/withdrawal of funds, etc.

If you think you are seeing this message by mistake and your location is not the US, kindly proceed to the website. Otherwise, you must leave the website in order to comply with government restrictions.

Why does your IP address show your location as the USA?

  • - you are using a VPN provided by a hosting company based in the United States;
  • - your IP does not have proper WHOIS records;
  • - an error occurred in the WHOIS geolocation database.

Please confirm whether you are a US resident or not by clicking the relevant button below. If you choose the wrong option, being a US resident, you will not be able to open an account with InstaForex anyway.

We are sorry for any inconvenience caused by this message.