To open long positions on GBP/USD, you need:
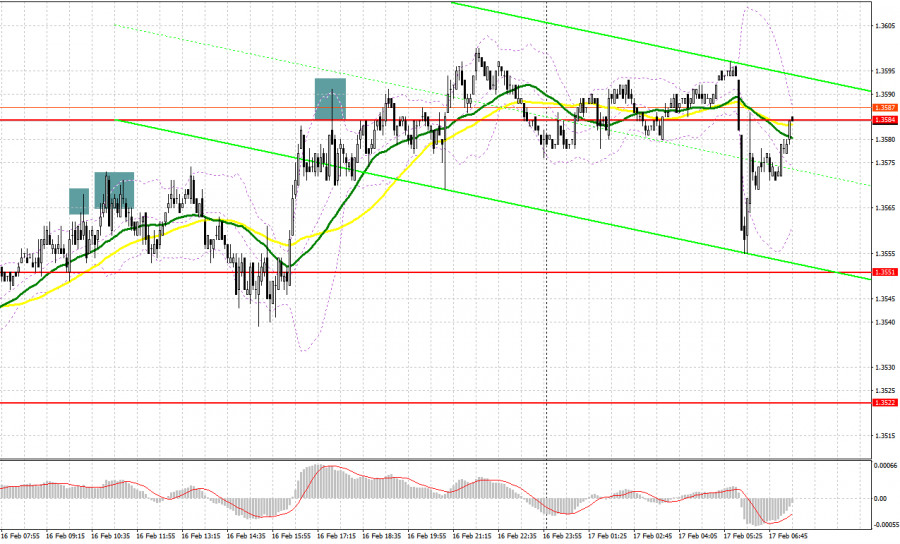
Yesterday, several signals were formed to enter the market. Let's take a look at the 5-minute chart and figure out what happened. In my morning forecast, I paid attention to the 1.3565 level and advised you to make decisions on entering the market from it. Everyone was waiting for the UK inflation data, so they were quite cautious when opening long positions on the pound. The pound's growth in the resistance area of 1.3565 and several false breakouts in the first half of the day led to a sell signal, however, the data showed that annual inflation in the UK reached the level of 5.5% — this is higher than economists' forecasts and not good for the Bank of England. For this reason, I did not wait for a major drop in the pound. The technical picture had completely changed in the afternoon, but it was not possible to wait for a good entry point from the 1.3551 level. Short positions at the price of 1.3584, after a false breakout, also did not lead to a serious downward movement of the pound during the US session.

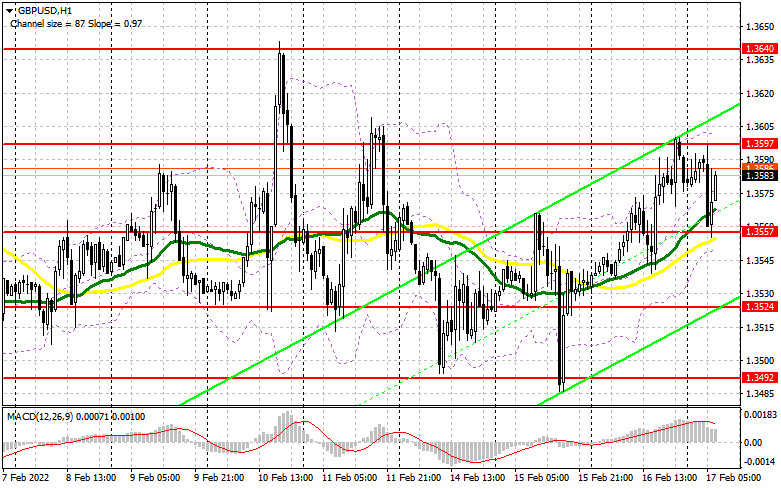
Today, traders have nothing to focus on in the morning, as there are no fundamental statistics for the UK. Most likely, bulls will continue to actively fight for the nearest resistance of 1.3597, which I recommend focusing on. However, the main task in the first half of the day is to protect the support of 1.3557, where the moving averages are playing on the bulls' side. You can consider long positions from 1.3557 only if a false breakout is formed, which will lead to a new wave of growth in the resistance area of 1.3597. It was not possible to go above this level yesterday. A breakthrough and a test of this range from top to bottom already creates an additional buy signal with a rise to 1.3640. A more distant target will be the 1.3683 area – a new monthly high, where I recommend taking profits. Nothing terrible will happen in case GBP/USD falls during the European session and bulls are not active at 1.3557. A slight downward correction is beneficial. Before buying, you need to make sure that the big players are still present in the market and all this growth is more stable and does not relate to speculative insinuations. If you fall below 1.3557, I advise you to wait for the test of the next major level of 1.3524. Forming a false breakout there, by analogy with what I analyzed above, will provide an entry point into long positions. You can buy the pound immediately on a rebound from 1.3492 – the lower limit of a wide horizontal channel, or even lower - from a low of 1.3465, counting on a correction of 20-25 points within the day.
To open short positions on GBP/USD, you need:
Bears have shown their presence in the market this morning and it is far from clear whether the upward correction in the pound will continue, or the entire weekly growth will be blocked by two sharp downward movements. Protecting the important resistance of 1.3597 is a very big deal, since it is absolutely undesirable to release the pound even higher – this will negate all of the bears' efforts to build a downward trend and open a direct path to monthly highs. Forming false breakouts at 1.3597 creates an excellent entry point into short positions, and in this case, you can count on the return of the bear market with a decline in the area of intermediate support 1.3557, formed by the results of morning trading. There are also moving averages that play on the bulls' side – so bears can perform two tasks at once with one blow. A breakthrough and test of this range from the bottom up will provide an additional entry point into short positions with the goal of falling to 1.3524 and 1.3492. A more distant target will be the 1.3465 area, where I recommend taking profits. If the pair grows during the European session, bears are not active at 1.3597, it is best to postpone short positions to this month's highs – 1.3640. I also advise you to open short positions there in case of a false breakout. You can sell GBP/USD immediately for a rebound from 1.3683, counting on the pair's rebound down by 20-25 points within the day.

I recommend for review:
The Commitment of Traders (COT) reports for February 8 showed a sharp increase in both short and long positions. The latter turned out to be much more, which led to a reduction in the negative value of the delta. However, the negative value still remained - this is a direct hint that bears control the market. It should be understood that this report already takes into account the results of the Bank of England meeting, at which interest rates were decided to be raised. But this did not provide much help to the pound, since everyone really understands that such changes in policy were made neither from a good life, but in the fight against high inflation. Given that the British economy is currently going through hard times and at any moment the pace of economic growth may seriously slow down - the increase in rates did not lead to a rapid increase in the British pound. The geopolitical events around Russia and Ukraine, as well as the Federal Reserve's decisive actions regarding future interest rates in March of this year - all this puts pressure on the bulls and is an additional deterrent to the bull market for GBP/USD. Some traders expect that the US central bank may resort to more aggressive actions and raise rates by 0.5% at once, rather than by 0.25% — this will become a kind of bullish signal for the US dollar. The COT report for February 8 indicated that long non-commercial positions increased from 29,597 to 44,709, while short non-commercial positions jumped not so much - from 53,202 to 53,254. This led to a sharp reduction in the negative non-commercial net position from -23,605 to -8,545. The weekly closing price rose from 1.3444 to 1.3537.
Indicator signals:
Trading is conducted above the 30 and 50 moving averages, which indicates an attempt by the bulls to continue the growth of the pair.
Moving averages
Note: The period and prices of moving averages are considered by the author on the H1 hourly chart and differs from the general definition of the classic daily moving averages on the daily D1 chart.
Bollinger Bands
In case of a decline, the lower border around 1.3545 will provide support. Crossing the upper limit in the area of 1.3600 will lead to a new wave of growth of the pound.
Description of indicators
- Moving average (moving average, determines the current trend by smoothing out volatility and noise). Period 50. It is marked in yellow on the chart.
- Moving average (moving average, determines the current trend by smoothing out volatility and noise). Period 30. It is marked in green on the chart.
- MACD indicator (Moving Average Convergence/Divergence — convergence/divergence of moving averages) Quick EMA period 12. Slow EMA period to 26. SMA period 9
- Bollinger Bands (Bollinger Bands). Period 20
- Non-commercial speculative traders, such as individual traders, hedge funds, and large institutions that use the futures market for speculative purposes and meet certain requirements.
- Long non-commercial positions represent the total long open position of non-commercial traders.
- Short non-commercial positions represent the total short open position of non-commercial traders.
- Total non-commercial net position is the difference between short and long positions of non-commercial traders.


