Analysis of Thursday's Trades:
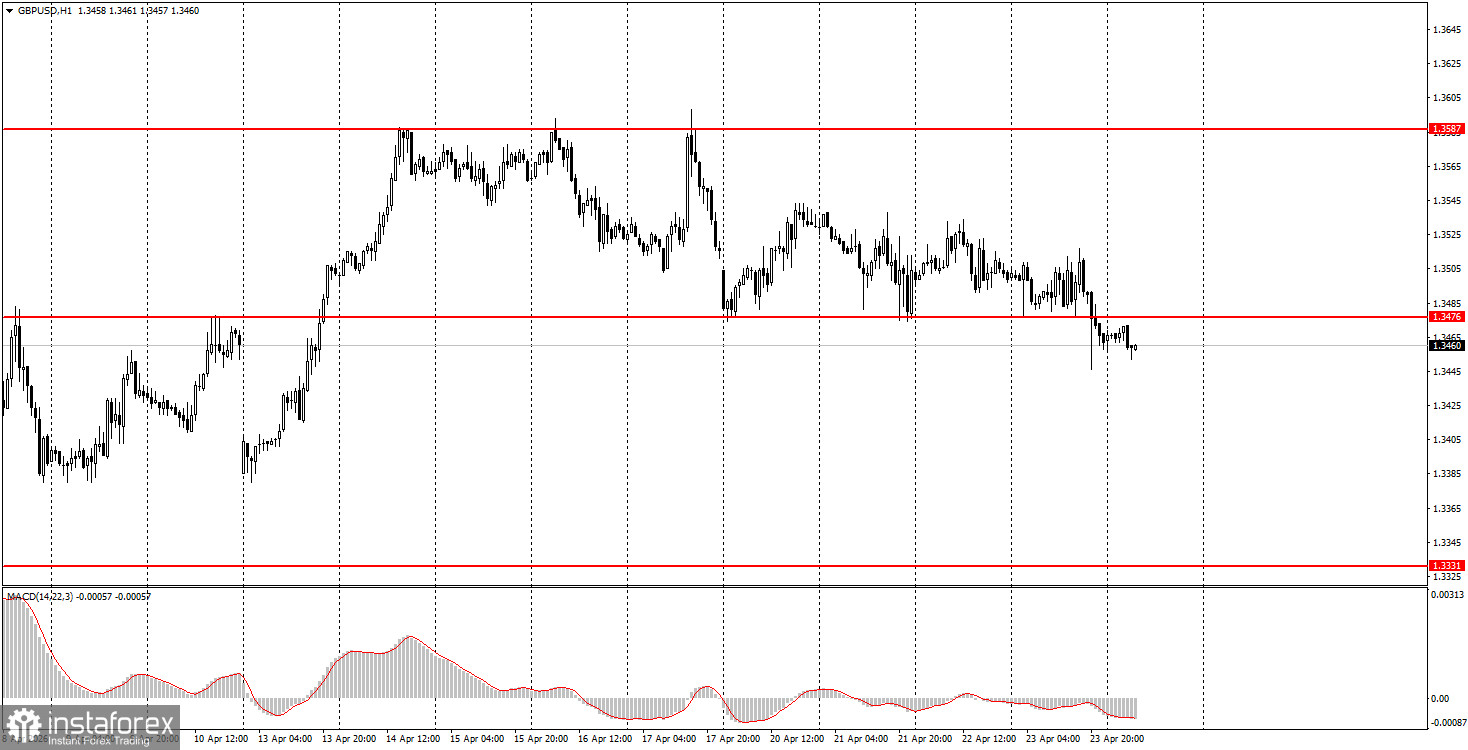
1H Chart of the GBP/USD Pair
The GBP/USD pair continued its weak downward movement on Thursday, even consolidating below 1.3476, indicating we are now in a correction rather than a flat trend. This development was precisely what we anticipated over the weekend. After two weeks of the euro and pound rallying, a correction was overdue. With no improvements observed in the Middle East, a slight strengthening of the dollar was quite predictable. However, we do not expect significant strengthening of the U.S. currency. The situation in the Middle East is not improving, but war has not resumed this week, as many had expected. Donald Trump extended the ceasefire with Iran, but he did not specify for how long. It's likely that both sides will seek a second round of negotiations; however, Tehran has set clear conditions: first, the lifting of the blockade on Iranian ports, and then negotiations. Trump has gone his own way and imposed a financial blockade on Iran. Each side continues to await concessions.
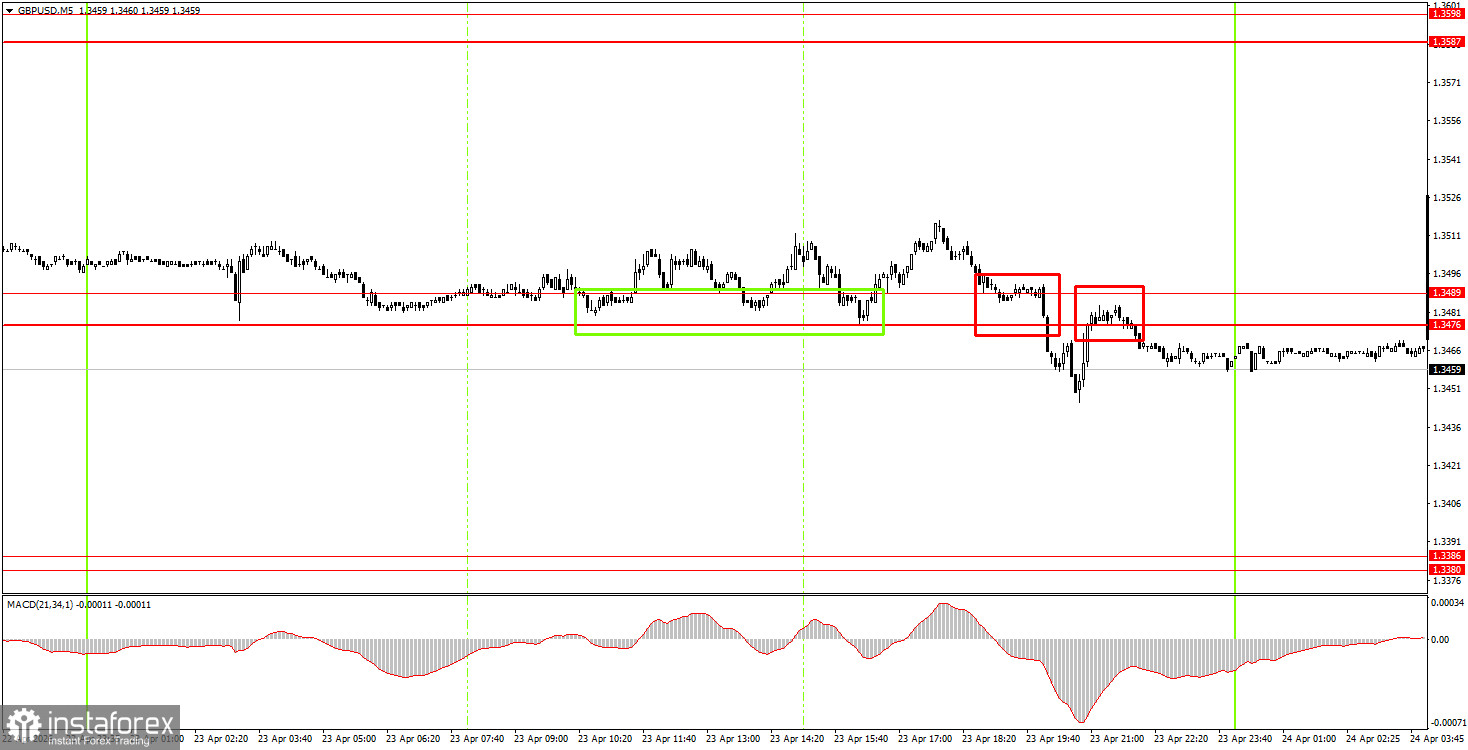
5M Chart of the GBP/USD Pair
On the 5-minute timeframe, several trading signals were formed on Thursday, but volatility throughout the day was weak, so none of the trades yielded significant profits. In principle, beginner traders could have capitalized on the first two bounces from the area of 1.3476-1.3489. After that, it became clear that there would be no further movements.
How to Trade on Friday:
On the hourly timeframe, the GBP/USD pair continues to form an upward trend but is currently experiencing a correction this week. There are no global reasons for medium-term dollar growth, which is why we expect the resumption of the global upward trend of 2025 in 2026. For this to happen, global geopolitical tensions must continue to subside. Currently, the market is suspended due to a lack of specifics. In any case, we believe that without a serious escalation in the Middle East, the dollar will no longer be able to sustain the growth it has shown over the last two months. At the same time, certain events can still provoke its strengthening.
On Friday, beginner traders can open short positions if the price bounces from the 1.3476-1.3489 area, targeting 1.3380-1.3386. If the price consolidates above the 1.3476-1.3489 area, long positions can be opened with targets of 1.3587-1.3598. However, volatility may remain low today as well.
On the 5-minute timeframe, levels to trade include 1.3175-1.3180, 1.3259-1.3267, 1.3319-1.3331, 1.3380-1.3386, 1.3476-1.3489, 1.3587-1.3598, 1.3695, and 1.3741-1.3751. Today, the UK retail sales report will be published, and the University of Michigan consumer sentiment index will be released in the US. The market is unlikely to notice these reports either...
Key Principles of the Trading System:
- The strength of the signal is determined by the time it took to form the signal (bounce or level breakthrough). The shorter the time, the stronger the signal.
- If two or more trades were opened around any level based on false signals, all subsequent signals from that level should be ignored.
- In a range, any pair can generate a lot of false signals or may not generate them at all. Technical levels may be ignored.
- On the hourly timeframe, it is advisable to trade MACD signals only when volatility is good, and the trend is confirmed by a trendline or trend channel.
- If two levels are located too close together (5-20 pips apart), they should be considered a support or resistance area.
- After moving 15 pips in the correct direction, a Stop Loss should be set to breakeven.
What to Look for on the Charts:
Price levels of support and resistance are levels that serve as targets when opening buys or sells. Take Profit levels can be placed around them.
Red lines represent channels or trend lines that show the current trend and indicate the direction in which it is preferable to trade now.
The MACD indicator (14,22,3) – the histogram and the signal line – is a supporting indicator that can also be used as a source of signals.
Important speeches and reports (always included in the news calendar) can significantly affect the movement of the currency pair. Therefore, during their release, trading should be done with utmost caution, or traders should exit the market to avoid sharp price reversals against the previous movement.
Beginning traders in the forex market should remember that not every trade can be profitable. Developing a clear strategy and effective money management are the keys to long-term trading success.