Bitcoin continues to trade within a sideways channel, but the technical picture still suggests a more likely decline for "digital gold" rather than an increase. On the 4-hour timeframe, a trendline has formed, clearly showing that each subsequent price high is lower than the previous one. Even in a flat market, Bitcoin is on the decline. Recall that the trend line serves as a trend indicator in classic technical analysis. In ICT analysis, it represents a liquidity pool. Behind the trend line are stop-loss orders and pending buy orders. This is the liquidity that market makers hunt for. Therefore, we certainly anticipate the removal of this liquidity and a resumption of the downward trend. Currently, there are no new patterns or signals.
On the daily timeframe, traders have the first "bullish" FVG in a long time, but the sideways channel and the trend line on the 4-hour timeframe are more significant right now. There has been no market reaction to the "bullish" FVG.
It should also be noted that Bitcoin has largely ignored the events in the Middle East, which have been unfolding for two days. Initially, a whole army of "experts" reported that Bitcoin was under pressure from geopolitics, but after the weekend, there was no decline, and no sharp or strong movements were observed. The first cryptocurrency still relies on technical factors and specifically the sideways channel, rather than being affected by the latest escalation of conflict during Trump's presidency, who has "already ended 8 wars."
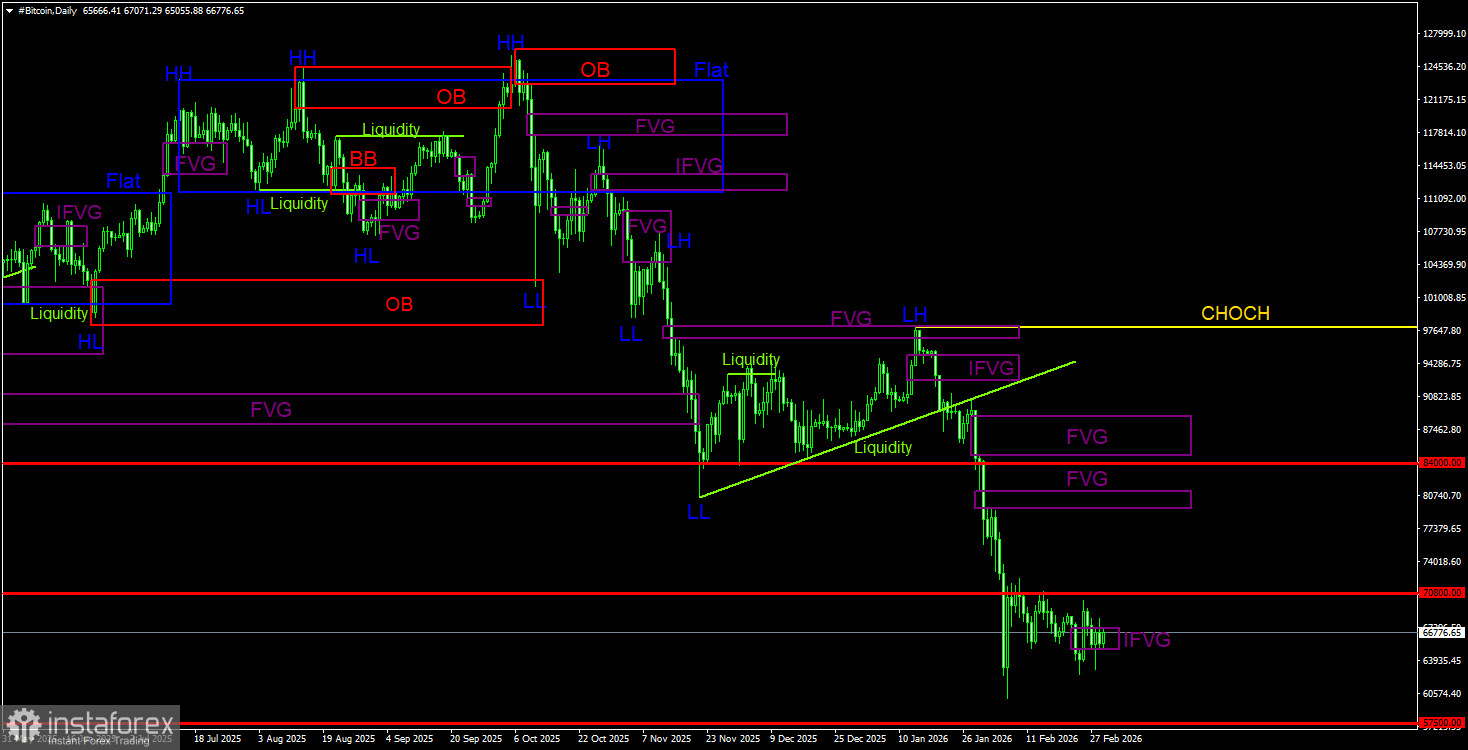
Overall Picture of BTC/USD on 1D
On the daily timeframe, Bitcoin continues to form a downward trend. The trend structure is identified as downward, with the CHOCH line currently passing at the level of $97,900. Only above this level can we say that the downward trend has ended. Recall that a sell signal was formed within the "bearish" FVG ($96,900 – $98,000) and received confirmation on the lower timeframe. Thus, traders had a great opportunity to capture almost all of the recent downward movement. The current target remains at $57,500 – 61.8% on the Fibonacci. Given the lack of signs of a reversal, we believe the decline will continue. On the daily timeframe, the nearest area of interest (POI) for new sell trades is in the range of $79,500 – $81,100. However, the flat trend persists on the 4-hour timeframe.
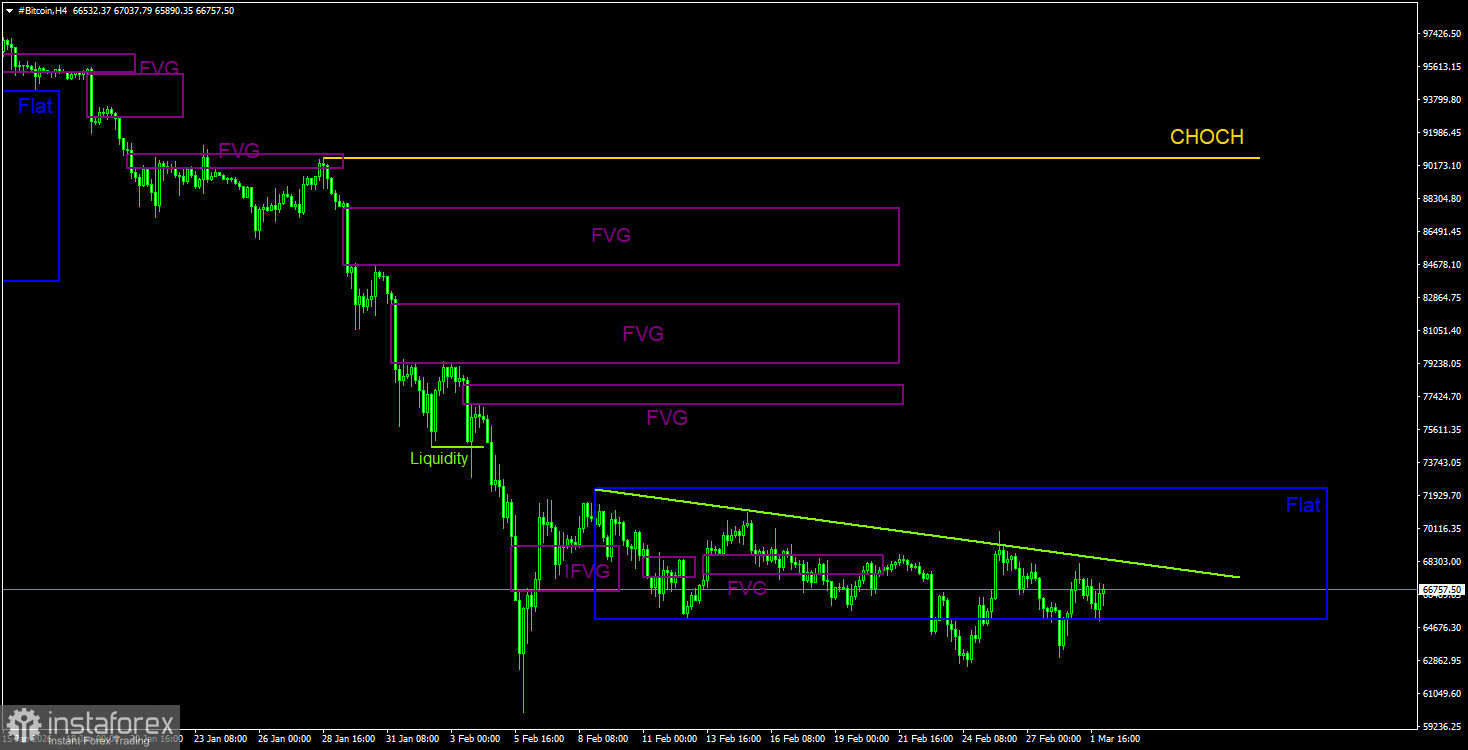
Overall Picture of BTC/USD on 4H
On the 4-hour timeframe, the price also continues to form a downward structure. The CHOCH line is at $90,560; only above this line can we speak of a trend shift to an upward one. However, at the moment, there are no signs that Bitcoin may end its decline anytime soon. The flat trend continues. We have observed two deviations at the lower boundary of the channel (which did not result in significant growth), and a trend line (also the liquidity pool) has formed, while Bitcoin is slowly sliding down, indicating that a decline is likely to resume soon.
Trading Recommendations for BTC/USD:
Bitcoin continues to form a full-fledged downward trend. We expect a decline with a target of $57,500 (the 61.8% level on the Fibonacci from the three-year upward trend), and there are currently no signs of a trend reversal. However, even the $57,500 level does not appear to be a final stop. Among the areas of interest (POI) at the moment, we can only highlight the nearest "bearish" FVG on the daily timeframe, which is located quite far from the price. We should also pay attention to the deviations at the upper boundary of the sideways channel on the 4-hour timeframe, as the trend remains downward.
Explanations for Illustrations:
- CHOCH – Change of Character in the trend structure.
- Liquidity – The liquidity from traders' stop-loss orders, which market makers use to build their positions.
- FVG – Fair Value Gap. Price moves very quickly through such areas, indicating a complete absence of one side in the market. Subsequently, the price tends to return to and react at these areas.
- IFVG – Inverted Fair Value Gap. After returning to such an area, the price does not react to it; it breaks through impulsively, then tests it from the other side.
- OB – Order Block. A candle in which the market maker opened a position aimed at extracting liquidity to form a position in the opposite direction.