empty
07.04.2025 07:13 PM
Forecast for EUR/USD on April 7, 2025

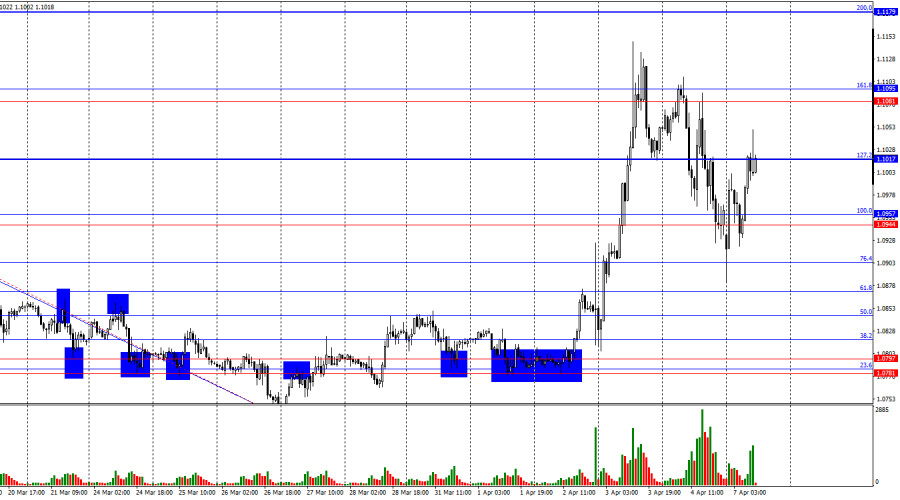
On Friday, it's difficult to define what exactly the EUR/USD pair accomplished. The decline is undeniable, signaling a strengthening of the U.S. dollar. But who can confidently say the dollar is truly rising? On Friday, the dollar strengthened, but on Thursday, it collapsed, and the new week started with another drop. Levels are being ignored, and traders are panicking, running from one side to the other. Chart analysis doesn't work anymore.

This image is no longer relevant

The wave structure on the hourly chart has changed. The last completed downward wave broke through the low of the previous wave, but the last upward wave also broke through the previous peak. Thus, waves currently indicate a potential trend reversal toward the bullish side. Donald Trump continues to impose new import tariffs, and panic and chaos persist in the markets. The bulls became active again last week, but it's difficult to say who really holds the initiative right now.

The news background on Friday undoubtedly helped the dollar and the bears. The Nonfarm Payrolls report showed 228,000 new jobs, while traders had expected significantly less. However, at the same time, the unemployment rate increased, and wage growth slowed from 4% to 3.8%. It's worth remembering that wage growth can reflect future inflation trends: if wages grow quickly, inflation may accelerate; if the pace slows, inflation may also decelerate. Therefore, only the Nonfarm report supported the dollar— the other two did not. Based on this, the following can be said. First, one should not interpret Friday's dollar strength as the end of its decline. Trump is still here, no impeachment has been filed, and he's ready to escalate the trade war further. And as we can see, not all countries are willing to blindly follow Washington's lead. In my view, the trade war will only expand, and the dollar may well continue to collapse on this wave.

This image is no longer relevant

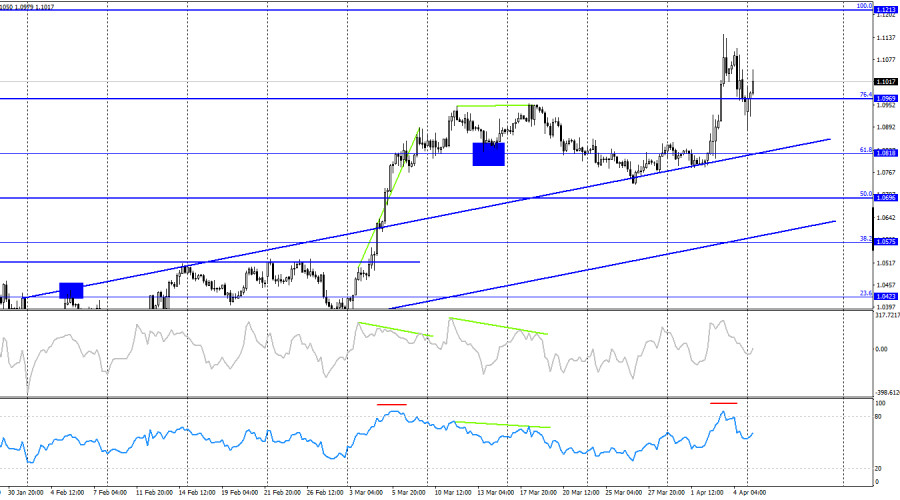
On the 4-hour chart, the pair completed a new reversal in favor of the euro and consolidated above the 76.4% retracement level – 1.0969. The euro's growth, which hasn't been supported by any EU data, could have ended long ago. However, Trump continues to exert intense pressure on the dollar. A close above 1.0969 allows for further growth toward the next Fibonacci level of 100.0% – 1.1213. The RSI indicator is overbought, but the news background is more important.

Commitments of Traders (COT) Report:

This image is no longer relevant

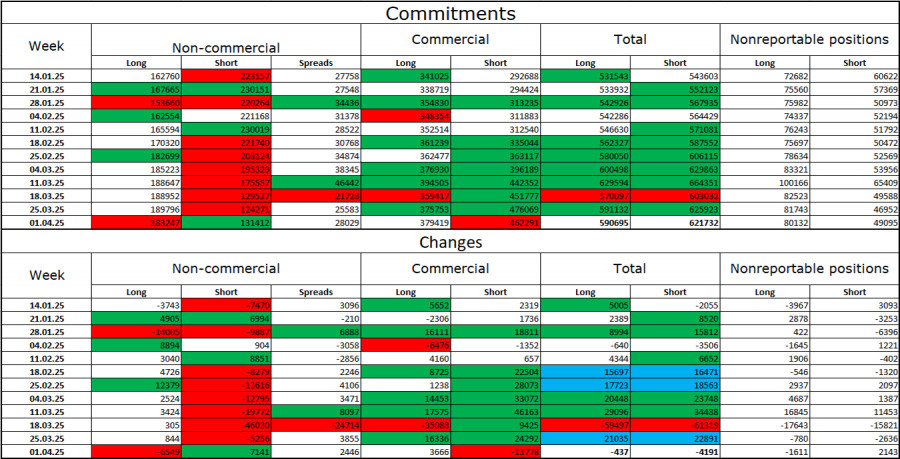
Over the last reporting week, professional traders closed 6,549 Long positions and opened 7,141 Short positions. The "Non-commercial" group sentiment has recently turned bullish again — thanks to Donald Trump. The total number of Long positions held by speculators now stands at 183,000, while Short positions number 131,000.

For twenty weeks, major players were getting rid of the euro, but for the past eight weeks, they've been reducing Short positions and increasing Long positions. The divergence in monetary policy between the ECB and the Fed still favors the U.S. dollar due to the widening rate differential, but Donald Trump's policies are becoming a more influential factor for traders, as they may exert a dovish influence on the Fed's policy and potentially lead to a recession in the U.S. economy.

News calendar for the U.S. and the Eurozone:

Eurozone – German Industrial Production (06:00 UTC) Eurozone – Retail Sales (09:00 UTC)

April 7 contains two scheduled events in the economic calendar. Their impact on market sentiment may be weak. However, it's worth remembering that tariff-related news is more important right now. If any party to the trade war introduces new tariffs or retaliatory measures over the weekend, Monday's market movements will not depend on these two Eurozone reports.

EUR/USD Forecast and Trading Tips:

Selling the pair is possible today on a rebound from the 1.1017 level on the hourly chart, with a target of 1.0957. Buying is possible on a close above 1.1017 on the hourly chart, targeting 1.1081. Given current volatility, avoiding risk may be the best strategy.

Fibonacci levels are plotted from 1.0957–1.0733 on the hourly chart and from 1.1214–1.0179 on the 4-hour chart.

Samir Klishi,
Especialista em análise na InstaForex
© 2007-2025
Selecionar intervalo de tempo
5
min
15
min
30
min
1
hora
4
horas
1
dia
1
s.
Ganhe com as variações das taxas das criptomoedas com a InstaForex.
Baixe o MetaTrader 4 e abra a sua primeira operação.
  • Grand Choice
    Contest by
    InstaForex
    InstaForex always strives to help you
    fulfill your biggest dreams.
    PARTICIPE DO CONCURSO

Recommended Stories

Sinais de negociação para o OURO para 15-19 de maio de 2025: comprar acima de $3.222 ou vender abaixo de $3.203 (EMA 200 - 5/8 de Murray)

No início da sessão americana, o ouro está sendo negociado em torno de US$ 3.195, abaixo da linha 5/8 de Murray e das médias móveis

Dimitrios Zappas 17:31 2025-05-15 UTC+2

Sinais de negociação para o BITCOIN para 15-19 de maio de 2025: venda abaixo de $103.600 (+1/8 Murray - SMA 21)

Caso o Bitcoin não consiga romper acima de US$ 103.700, espera-se uma nova correção técnica. Nesse cenário, o preço pode recuar até o nível psicológico de US$ 100.000, podendo inclusive

Dimitrios Zappas 17:24 2025-05-15 UTC+2

Previsão para o EUR/USD em 15 de maio de 2025

Na quarta-feira, o par EUR/USD subiu em direção à zona de resistência entre 1,1265 e 1,1282, recuou a partir dela e inverteu o movimento em favor do dólar americano

Samir Klishi 16:17 2025-05-15 UTC+2

Análise técnica do movimento intradiário dos preços do índice Nasdaq 100, quinta-feira, 15 de maio de 2025

Se observarmos o gráfico de 4 horas do índice Nasdaq 100, vemos que o preço está acima da média móvel ponderada de 21 períodos (WMA 21), que apresenta inclinação ascendente

Arief Makmur 15:37 2025-05-15 UTC+2

Previsão para o GBP/USD em 15 de maio de 2025

No gráfico horário, o par GBP/USD subiu para a zona de resistência de 1,3344-1,3357 na quarta-feira, recuperou-se dela, e começou um movimento para baixo em direção ao nível Fibonacci

Samir Klishi 15:19 2025-05-15 UTC+2

Sinais de negociação para o EUR/USD para 14-19 de maio de 2025: venda abaixo de 1,1230 ( EMA 200 - SMA 21)

O euro pode retomar o movimento de queda. Para isso, será necessário observar um fechamento abaixo de 1,1186 no gráfico de 4 horas. Caso isso ocorra, o preço poderá recuar

Dimitrios Zappas 20:25 2025-05-14 UTC+2

Sinais de negociação para o OURO para 14-19 de maio de 2025: compre acima de US$ 3.175 (EMA 200 - recuperação)

O ouro também deixou um gap em torno de 3.325, que pode ser preenchida nos próximos dias. Para isso, será necessário que o preço se consolide acima de 3.230

Dimitrios Zappas 20:10 2025-05-14 UTC+2

WTI - West Texas Intermediate. Análise e previsão

Os preços do petróleo bruto norte-americano West Texas Intermediate (WTI) estão se consolidando próximos da máxima de um mês, interrompendo uma sequência de quatro dias consecutivos de valorização. No entanto

Irina Yanina 18:02 2025-05-14 UTC+2

Análise técnica do movimento intradiário de preços do AUD/JPY, quarta-feira, 14 de maio de 2025

Embora, no gráfico de 4 horas, o par cruzado AUD/JPY ainda esteja se movendo acima da WMA (30, deslocamento 2) — que apresenta inclinação ascendente — o indicador Estocástico

Arief Makmur 17:45 2025-05-14 UTC+2

Análise técnica do movimento diário de preços do petróleo bruto, quarta-feira, 14 de maio de 2025

Com base na análise do gráfico de 4 horas do contrato de petróleo bruto (#CL), observam-se diversos elementos técnicos relevantes. Primeiramente, destaca-se a formação de um padrão de "Fundo Duplo"

Arief Makmur 17:31 2025-05-14 UTC+2
Não pode falar agora?
Faça sua pergunta no chat.
Widget callback
 

Dear visitor,

Your IP address shows that you are currently located in the USA. If you are a resident of the United States, you are prohibited from using the services of InstaFintech Group including online trading, online transfers, deposit/withdrawal of funds, etc.

If you think you are seeing this message by mistake and your location is not the US, kindly proceed to the website. Otherwise, you must leave the website in order to comply with government restrictions.

Why does your IP address show your location as the USA?

  • - you are using a VPN provided by a hosting company based in the United States;
  • - your IP does not have proper WHOIS records;
  • - an error occurred in the WHOIS geolocation database.

Please confirm whether you are a US resident or not by clicking the relevant button below. If you choose the wrong option, being a US resident, you will not be able to open an account with InstaForex anyway.

We are sorry for any inconvenience caused by this message.