Analyzing Friday's trades:
GBP/USD on 30M chart
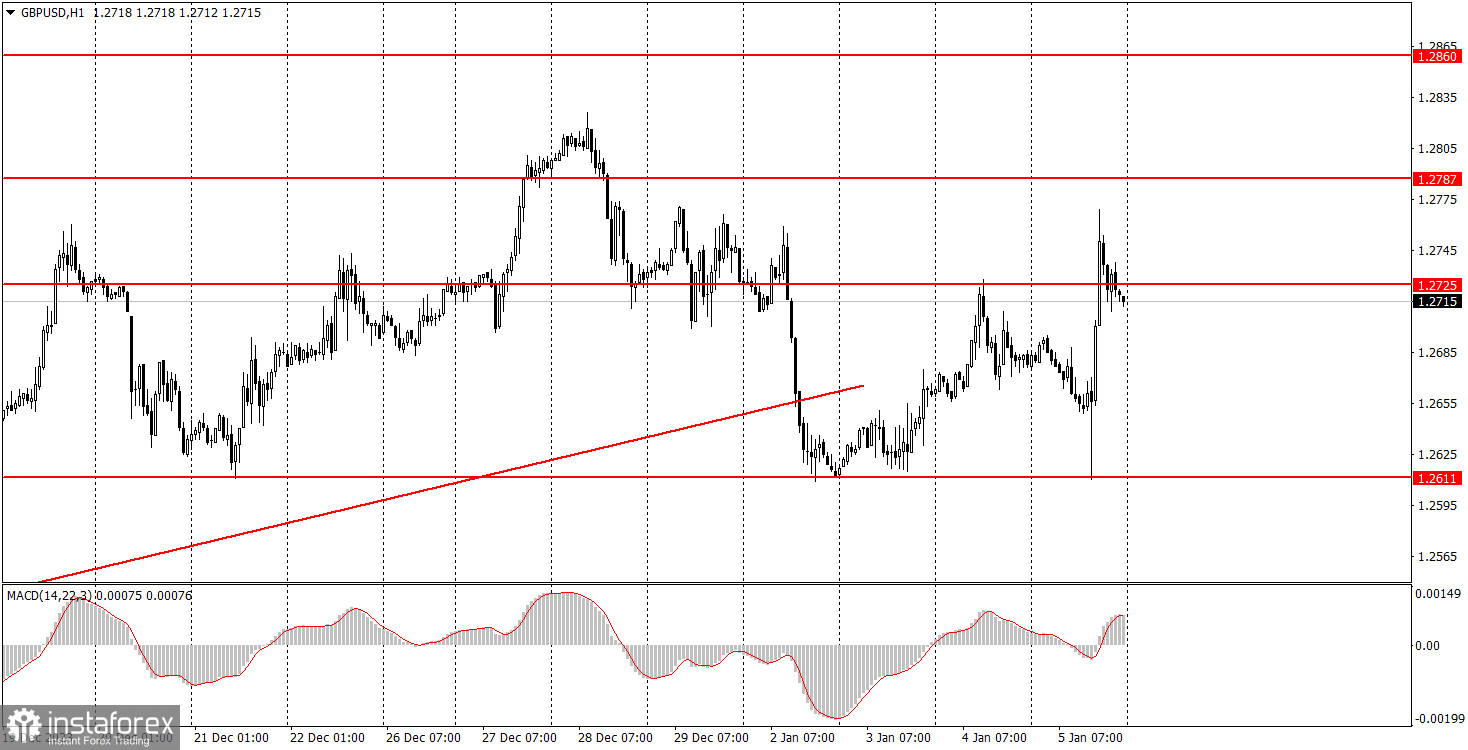
GBP/USD continued to trade higher on Friday. If the euro had a reason to fall in the first half of the day, the pound was depreciating alongside it. The dollar had much more reasons to rise than fall in the second half of the day, but in the end, the pound traded positively while the greenback fell. We have already mentioned how illogical it was for the dollar to fall on Friday. However, we would like to add that another important ISM report on business activity in the services sector turned out to be weaker than market expectations, which worked against the dollar. However, this report alone could not override the positive unemployment and Nonfarm payrolls, so we consider it illogical for the pair to rise on Friday.
Take note that the price failed to overcome the level of 1.2611 for the third time in two weeks. Therefore, the pound has not even managed to correct lower for several weeks, let alone something more. Therefore, we stick to our previous opinion: no matter what the reports are, no matter what the fundamentals are, if the market refuses to buy the dollar, nothing will make the pair fall. The pair's movements are still illogical and baseless.
GBP/USD on 5M chart
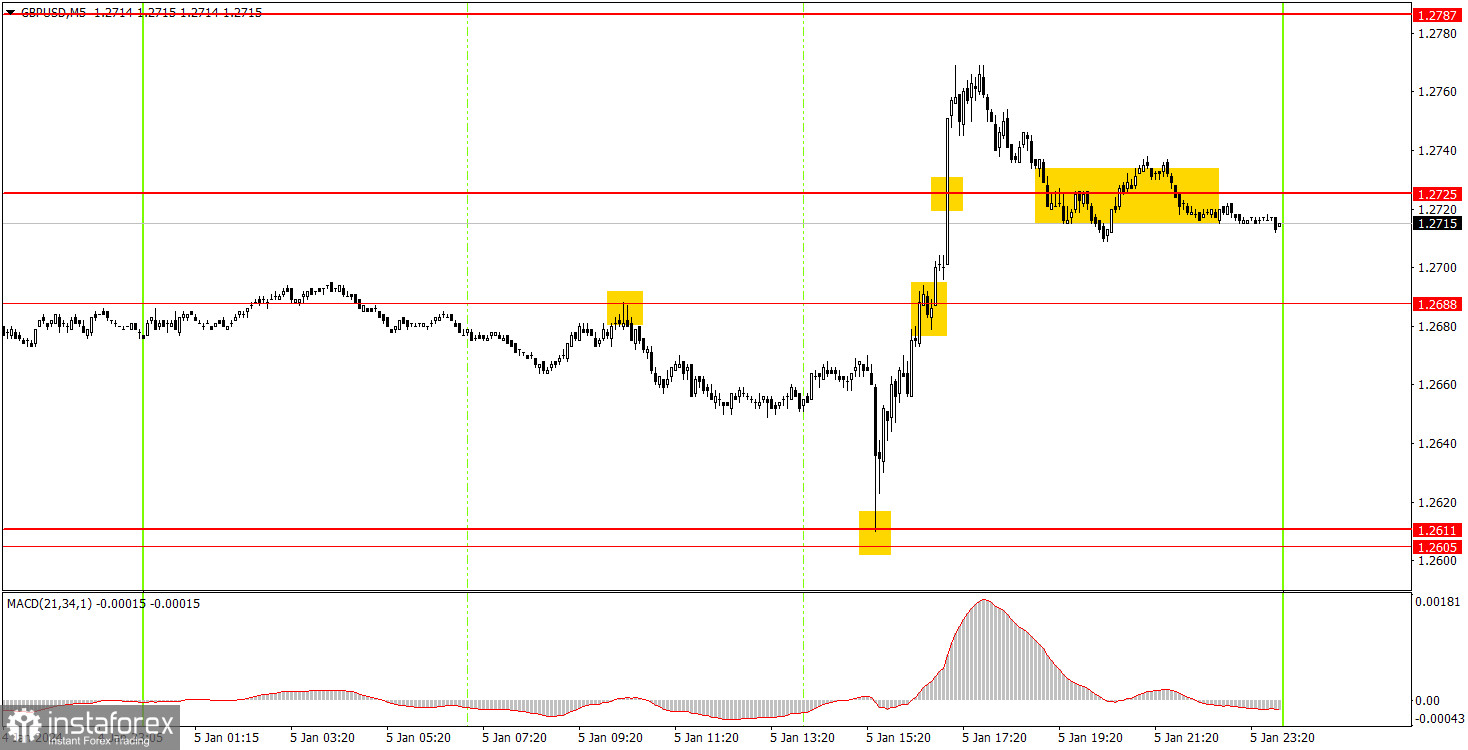
There were quite a few signals on the 5-minute chart. During the European trading session, the price rebounded from the 1.2688 level, after which it managed to drop to the 1.2611 level. Since the short position was opened long before the release of U.S. reports, it was simply a matter of setting a Stop Loss to breakeven and patiently waiting for the target to be reached. A buy signal also formed around the 1.2611 level, which could have been executed. Subsequently, the pair grew by about 130 pips, and long positions could have been closed around the 1.2725 level in the evening. Therefore, two positions were opened, and the total profit amounted to 125 pips.
Trading tips on Monday:
On the hourly chart, GBP/USD broke the trendline and now, for the first time in a long while, has a real chance of forming a new downtrend. However, traders have not been able to break through the 1.2611 level, so the downward movement was postponed once again.
We expect relatively low volatility and a flat market. It's possible that a few false signals may form around the 1.2725 level during the day. We will only pay attention to clear rebounds and breaches of the 1.2688 and 1.2725 levels. If there are no such signals, we will refrain from entering the market.
The key levels on the 5M chart are 1.2270, 1.2310, 1.2372-1.2387, 1.2457, 1.2502, 1.2544, 1.2605-1.2611, 1.2688, 1.2725, 1.2787-1.2791, 1.2848-1.2860, 1.2913, 1.2981-1.2993. On Monday, there are no significant reports or events lined up in either the UK or the US. Therefore, we do not expect strong movements.
Basic trading rules:
1) Signal strength is determined by the time taken for its formation (either a bounce or level breach). A shorter formation time indicates a stronger signal.
2) If two or more trades around a certain level are initiated based on false signals, subsequent signals from that level should be disregarded.
3) In a flat market, any currency pair can produce multiple false signals or none at all. In any case, the flat trend is not the best condition for trading.
4) Trading activities are confined between the onset of the European session and mid-way through the U.S. session, after which all open trades should be manually closed.
5) On the 30-minute timeframe, trades based on MACD signals are only advisable amidst substantial volatility and an established trend, confirmed either by a trendline or trend channel.
6) If two levels lie closely together (ranging from 5 to 15 pips apart), they should be considered as a support or resistance zone.
How to read charts:
Support and Resistance price levels can serve as targets when buying or selling. You can place Take Profit levels near them.
Red lines represent channels or trend lines, depicting the current market trend and indicating the preferable trading direction.
The MACD(14,22,3) indicator, encompassing both the histogram and signal line, acts as an auxiliary tool and can also be used as a signal source.
Significant speeches and reports (always noted in the news calendar) can profoundly influence the price dynamics. Hence, trading during their release calls for heightened caution. It may be reasonable to exit the market to prevent abrupt price reversals against the prevailing trend.
Beginners should always remember that not every trade will yield profit. Establishing a clear strategy coupled with sound money management is the cornerstone of sustained trading success.